 |
| Previous Image | Next Image |
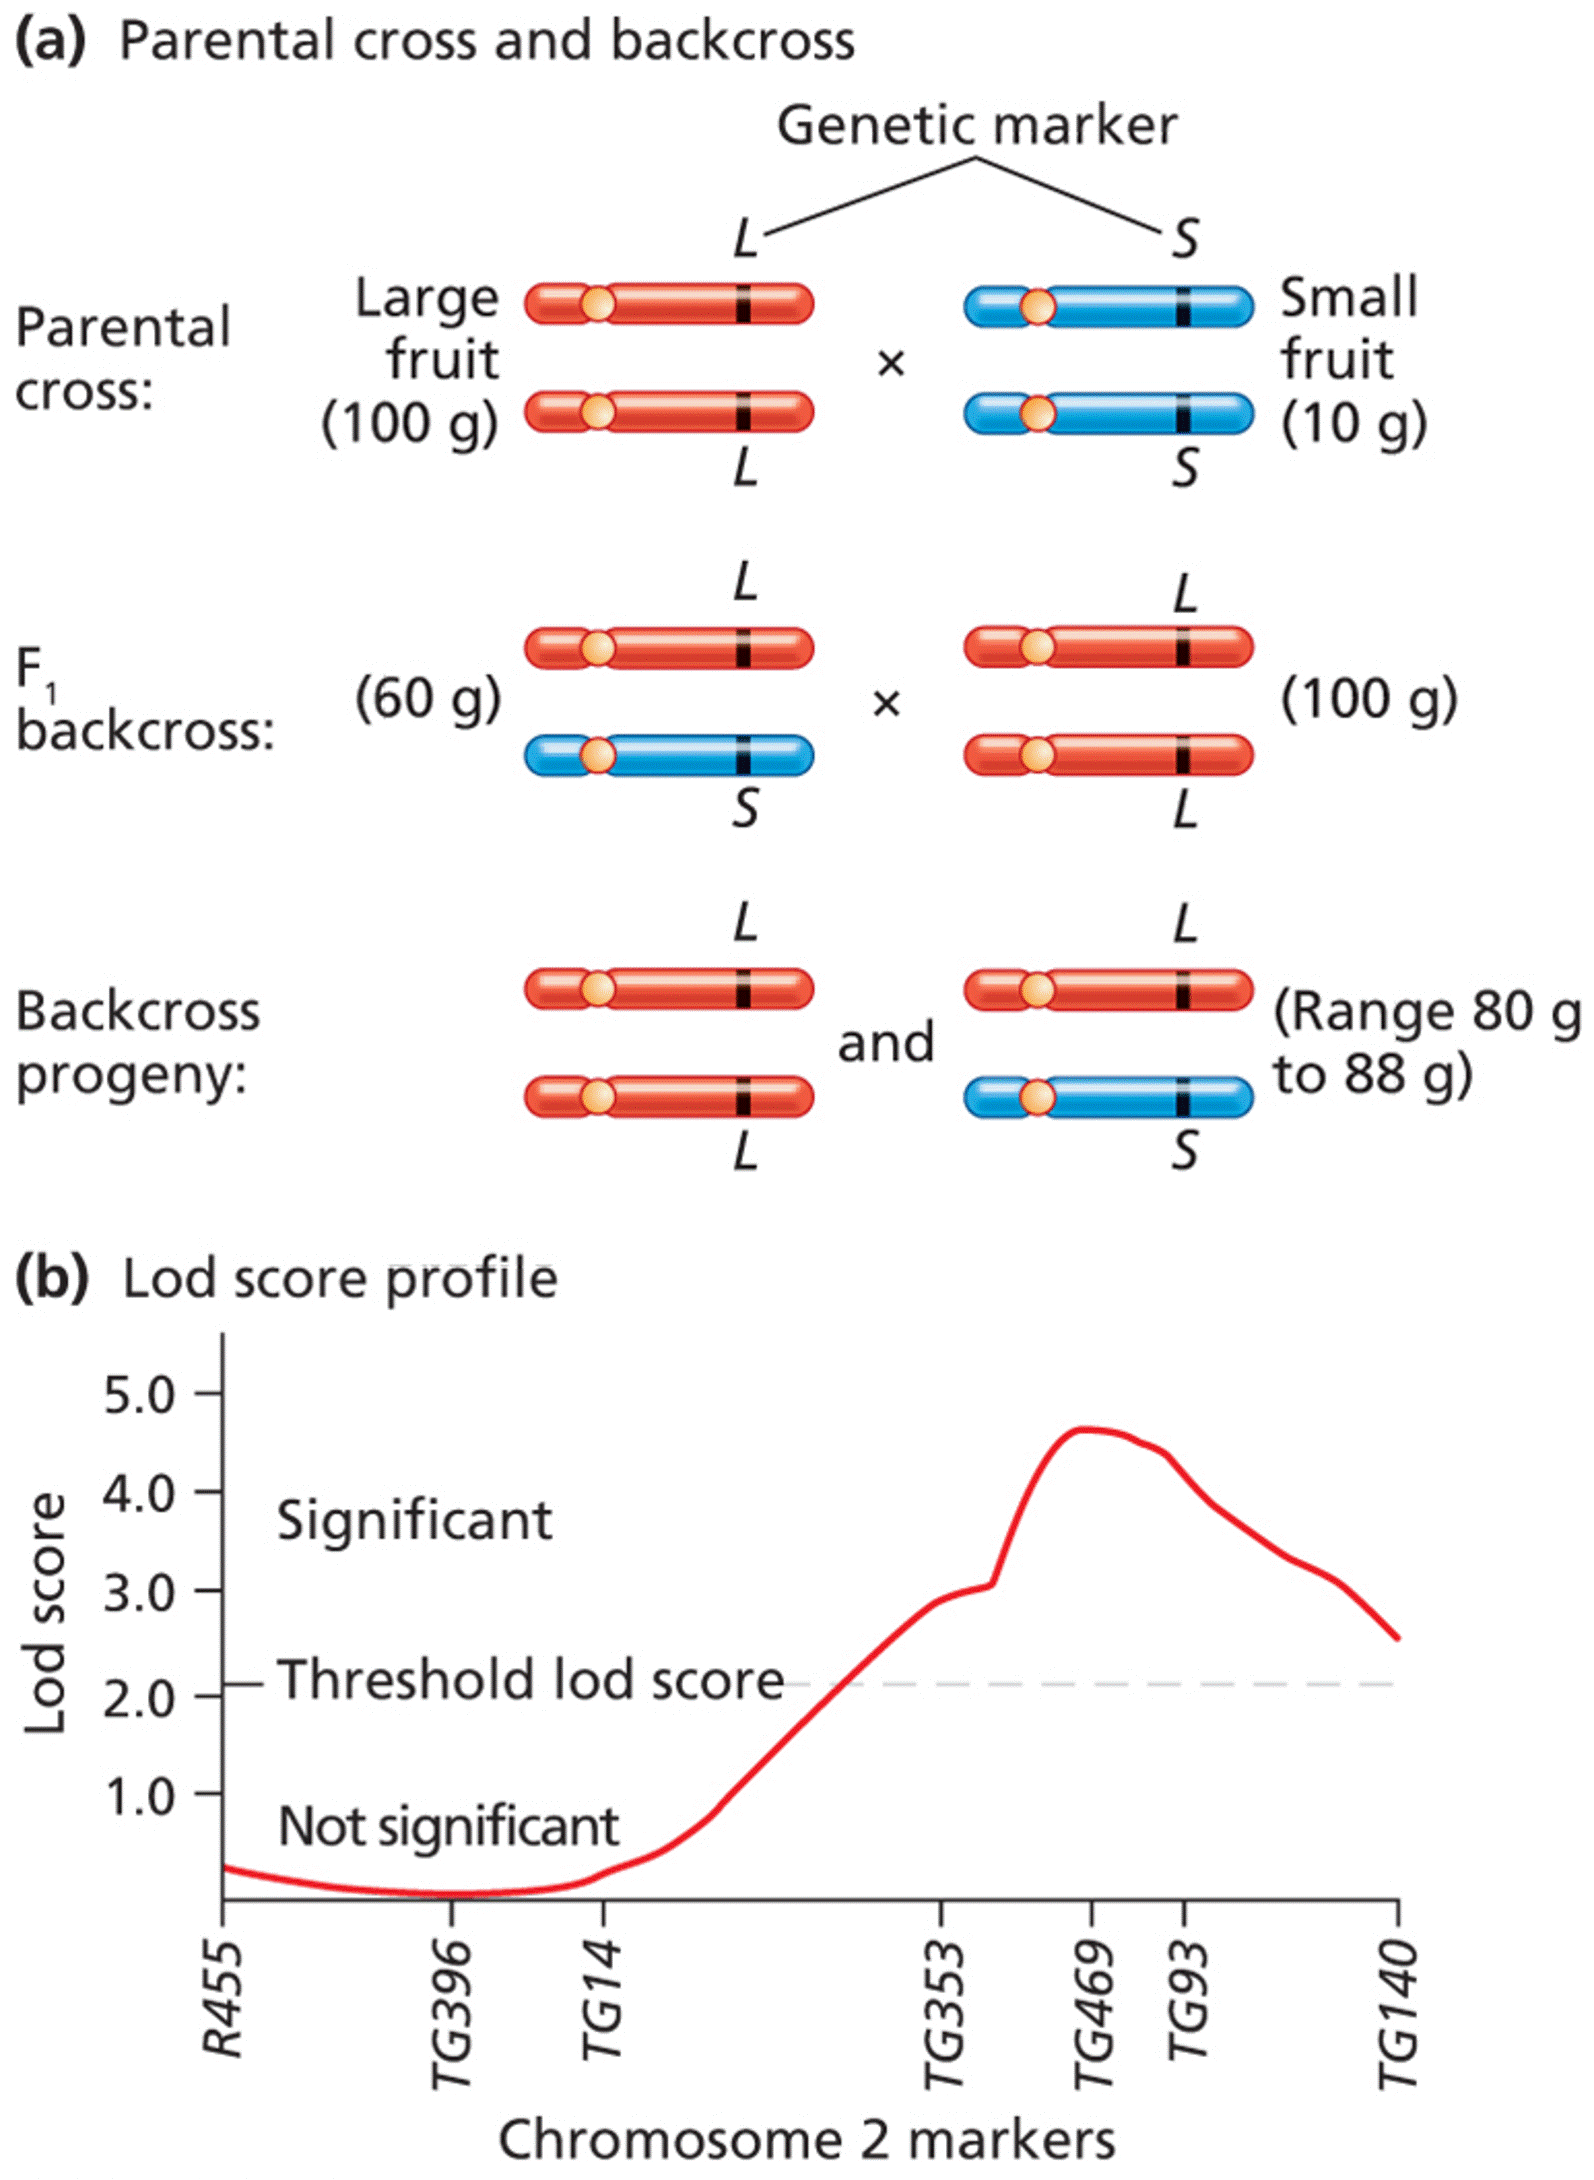
| Description: (a) Parental tomato plants producing large fruit (and homozygous for L marker alleles) or small fruit (and homozygous for S marker alleles) are crossed to produce F1 (LS). The F1 are then backcrossed to the large-fruit line to yield backcross progeny that are either LL or LS. (b) The significance of linkage between potential QTLs and genetic markers is tested among backcross progeny by lod score analysis. A lod score profile assessing fruit-weight QTLs reveals significant scores exceeding the threshold value on tomato chromosome 2(a) Parental tomato plants producing large fruit (and homozygous for L marker alleles) or small fruit (and homozygous for S marker alleles) are crossed to produce F1 (LS). The F1 are then backcrossed to the large-fruit line to yield backcross progeny that are either LL or LS. (b) The significance of linkage between potential QTLs and genetic markers is tested among backcross progeny by lod score analysis. A lod score profile assessing fruit-weight QTLs reveals significant scores exceeding the threshold value on tomato chromosome 2 (a) Parental cross and backcross Genetic marker L/\$ Parental Largem ESma” cross fruit x fruit ' (100mm,- Esuog) L L F m E backcross (60 g) E x E (100 g) - S L L L Backcross E and E (Range 80 g ngeny‘ ca? 8‘5 t0 88 9) (b) Lod score profile 50 4D 3D 20 LO Significant Threshold lod score Lod score Not significant R455 TG396 T614 TG353 T6469 T693 T6140 Chromosome 2 markers Picture Stats: Views: 156 Filesize: 303.53kB Height: 2180 Width: 1594 Source: https://biology-forums.com/index.php?action=gallery;sa=view;id=48939 |
