 |
| Previous Image | Next Image |
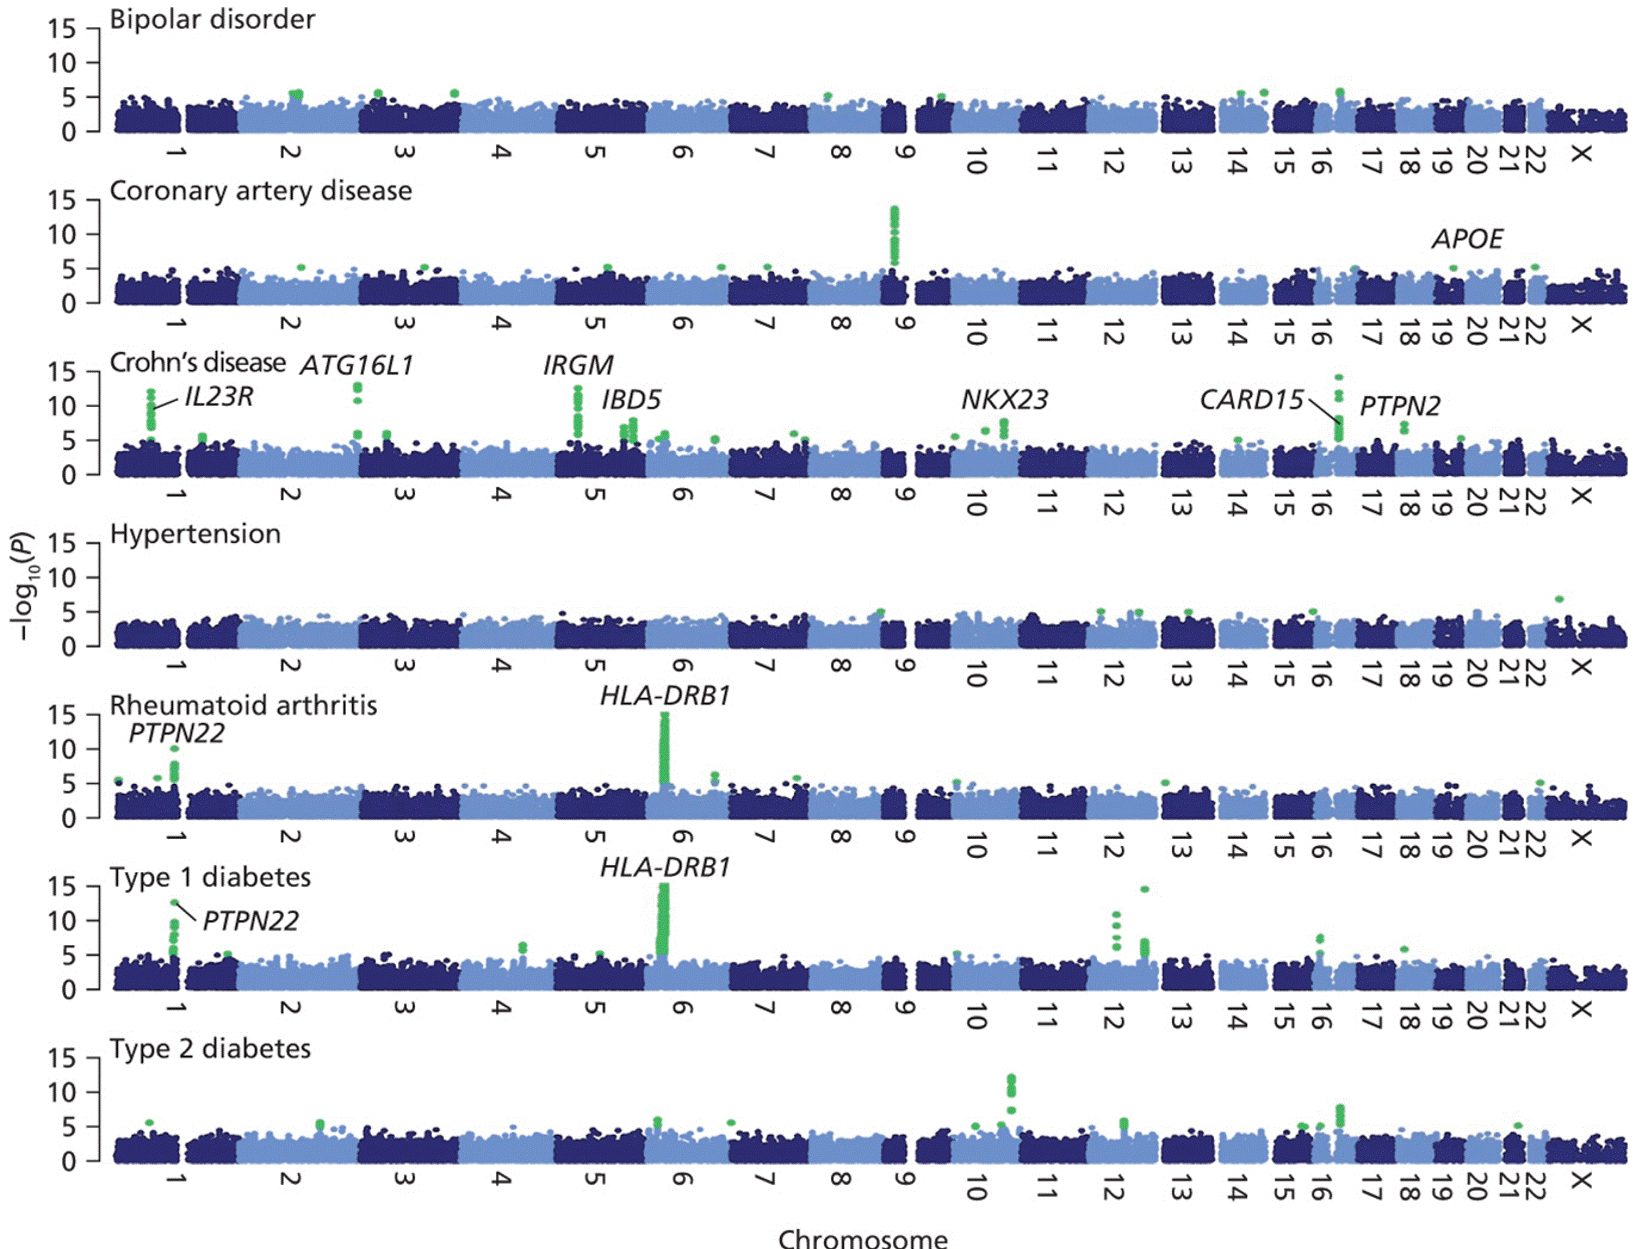
| Description: The vertical axes show the P value for each SNP–disease association along 22 autosomes and the X chromosome. Green dots and bars mark the locations of regions yielding significant associations. Known genes mapping to these regions are shownThe vertical axes show the P value for each SNP–disease association along 22 autosomes and the X chromosome. Green dots and bars mark the locations of regions yielding significant associations. Known genes mapping to these regions are shown Bipolar disorder Coronary artery disease Ii. -. _x N w Crohn's disease ATG16L 1 IL23R 3 .0- _\ N W Hypertension —‘ N W Rheumatoid arthritis PTP.N22 m cm U1 ox IRGM IBDS U1 on m m HLA-DRB1 m m _. _. _. O —‘ N NKX23 . . . a . on L0 —‘ —| a 3 CARD15\I m E a a Type 1 diabetes \I PTPNZZ —‘ N W Type 2 diabetes —‘ N W :5 U1 0‘ \l on \D o o _. _\ o d 21. Chromosome Picture Stats: Views: 152 Filesize: 336.62kB Height: 1249 Width: 1636 Source: https://biology-forums.com/index.php?action=gallery;sa=view;id=49067 |
