 |
| Previous Image | Next Image |
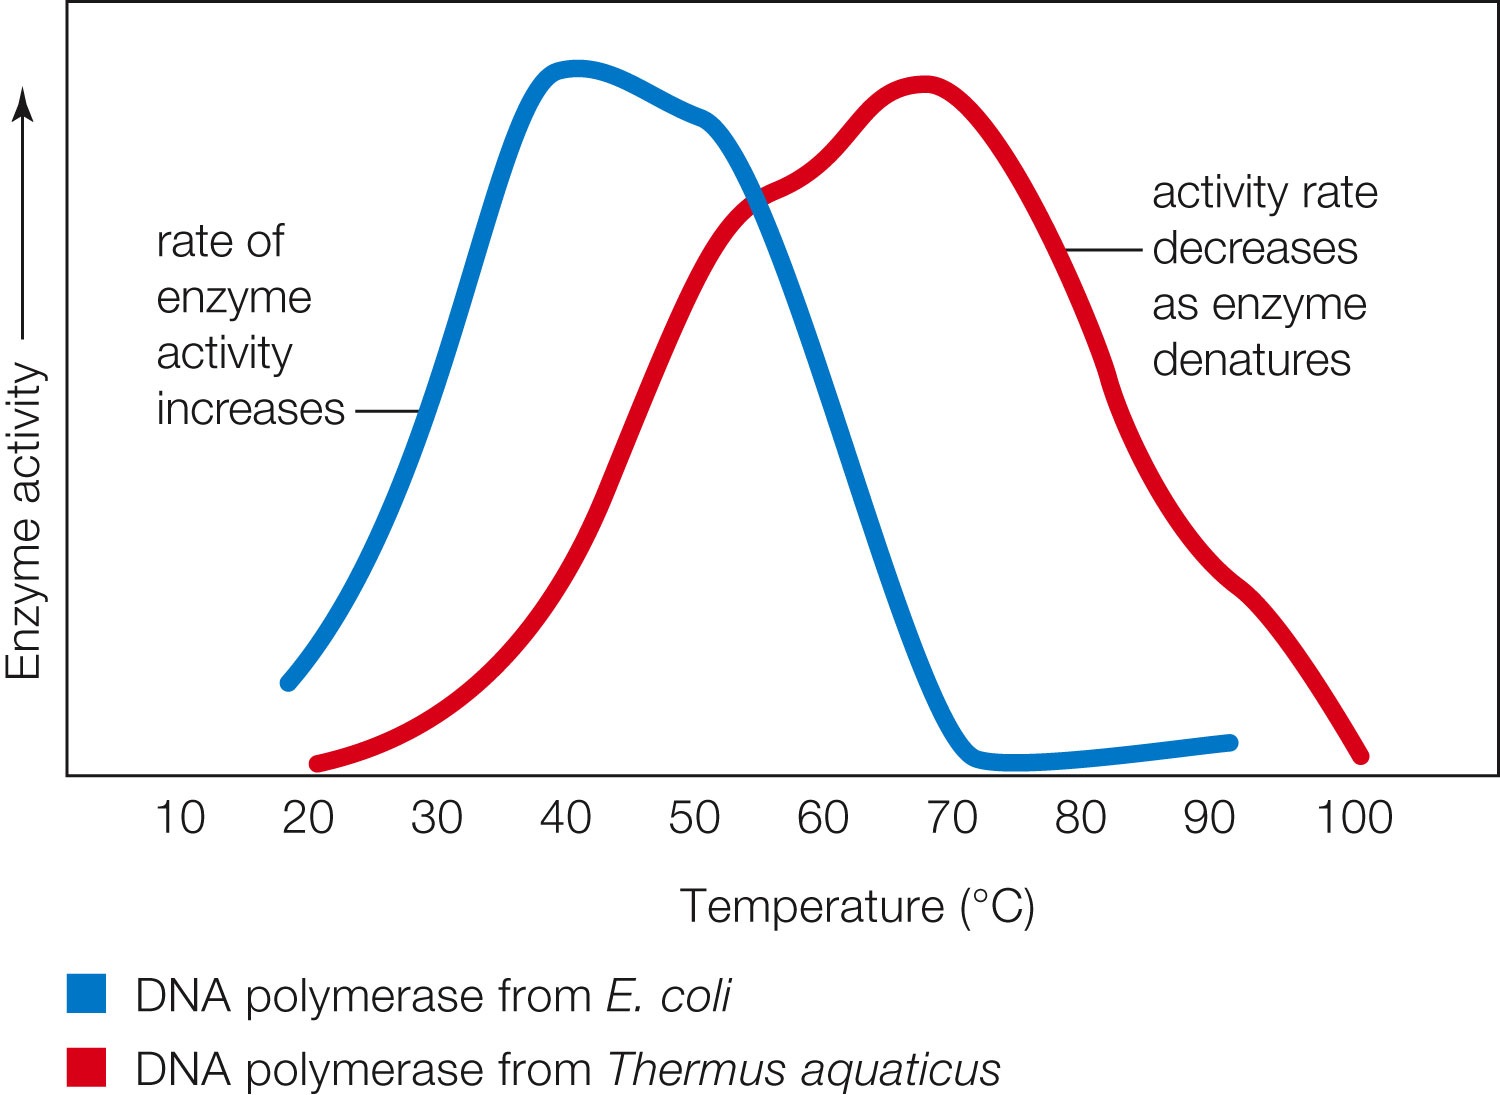
| Description: The rate of an enzymatic reaction typically increases with temperature , up to a point. After that point, the rate falls sharply as the enzyme denatures. E. coli inhabits the gut (normally 37°C); T. aquaticus lives in hot springs, preferably at 70°C. Graphs like the one shown here are called activity profiles. Each enzyme has a characteristic temperature/activity profile curve.
Picture Stats: Views: 633 Filesize: 184.46kB Height: 1095 Width: 1500 Source: https://biology-forums.com/index.php?action=gallery;sa=view;id=49506 |
