 |
| Previous Image | Next Image |
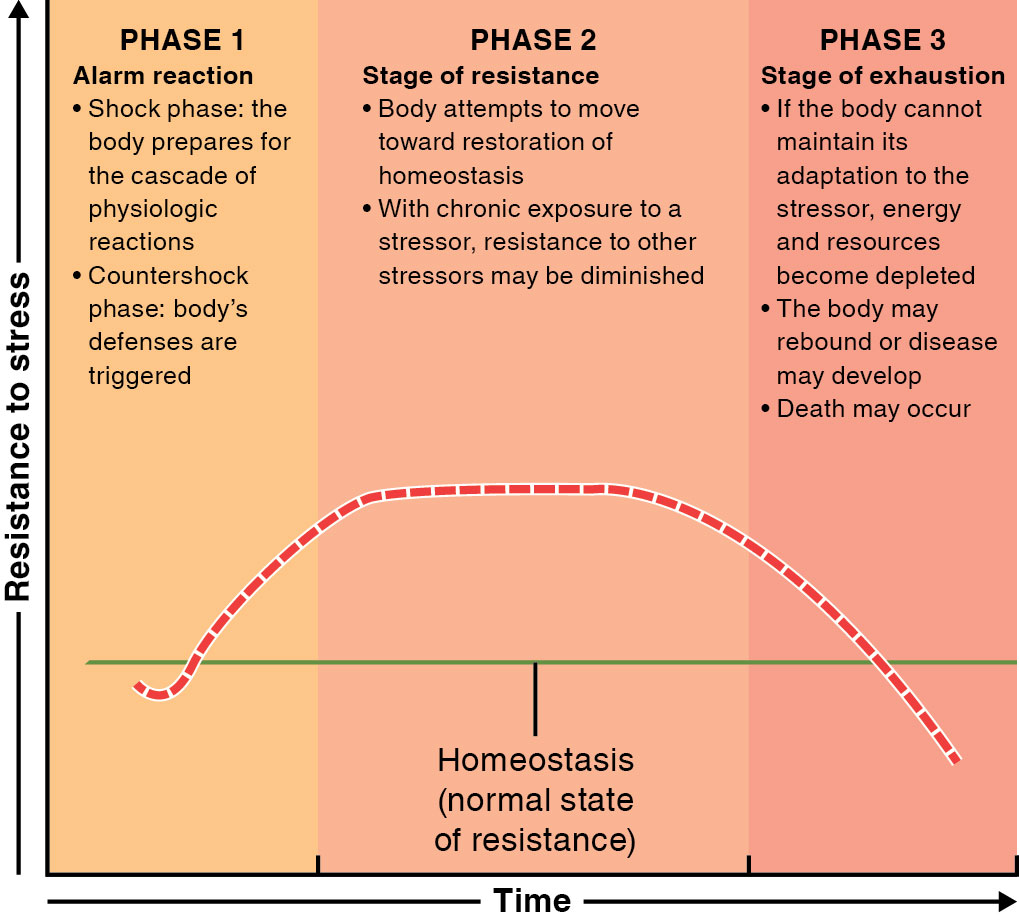
| Description: The chart shows resistance to stress over time. There is a horizontal line representing homeostasis, the normal state of resistance. The resistance starts out just below homeostasis. In phase 1, the alarm reaction, there are two sub phases. In the shock phase, the body prepares for the cascade of physiological reactions. In the countershock phase, the body’s defenses are triggered. Resistance begins to trend upward. In phase 2, resistance reaches it’s peak and plateaus. In this stage of resistance, the body attempts to move toward restoration of homeostasis. With chronic exposure to a stressor, resistance to other stressors may be diminished. In phase 3, resistances trends down, well below the homeostasis level. If the body cannot maintain its adaptation to the stressor, energy and resources become depleted. The body may rebound or disease may develop. Death may occur. Picture Stats: Views: 643 Filesize: 184.47kB Height: 923 Width: 1019 Source: https://biology-forums.com/index.php?action=gallery;sa=view;id=49636 |
