This topic contains a solution. Click here to go to the answer
|
|
|

 Differences in the number and location of flagella.
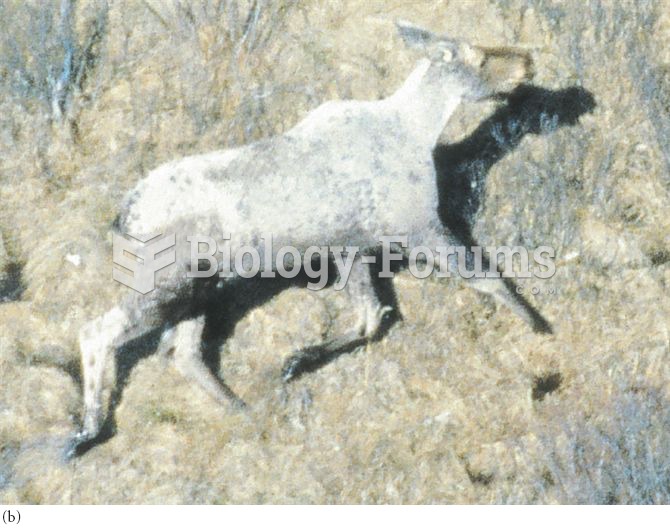 (a) With few ticks, moose retain a brown coat; (b) at high numbers of ticks, moose self-groom, destr
 question asked
 Per capita consumption of power is high in the developed world and highest in the United States
 The average weight gain between Thanksgiving and New Year's Day is about a pound
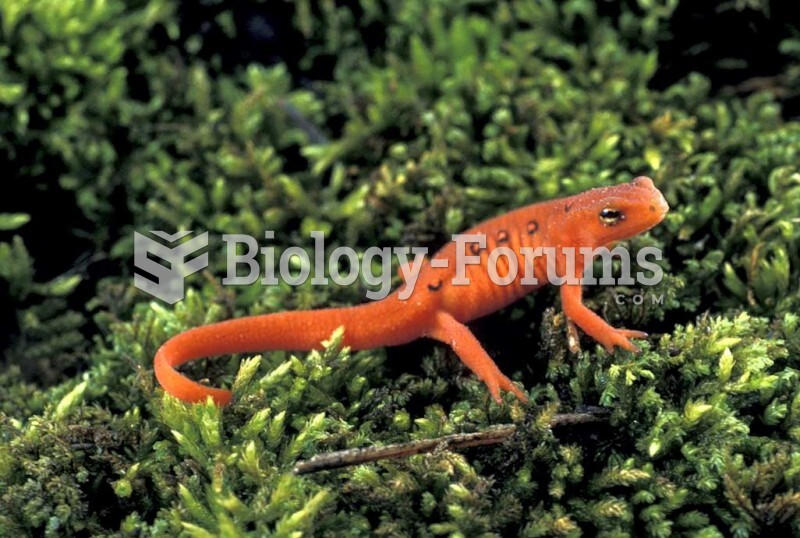 Red Spotted Newt (Notophthalmus v. viridescens), New Hampshire state animal.