This topic contains a solution. Click here to go to the answer
|
|
|

Did you know?
Methicillin-resistant Staphylococcus aureus or MRSA was discovered in 1961 in the United Kingdom. It if often referred to as a superbug. MRSA infections cause more deaths in the United States every year than AIDS.

 Cyanobacteria of the (a) genus Synechococcus form (b) mats that line hot springs around the world.
 Term neonate.
 A Double-Line Spectroscopic Binary
 Herbert Spencer (1820–1903), sometimes called the second founder of sociology, coined the term ...
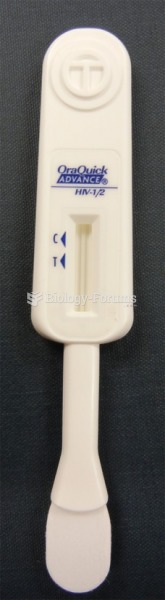 OraQuick. A negative result would show a red line at the "C" mark, whereas a positive ...
 Beau’s line