This topic contains a solution. Click here to go to the answer
|
|
|

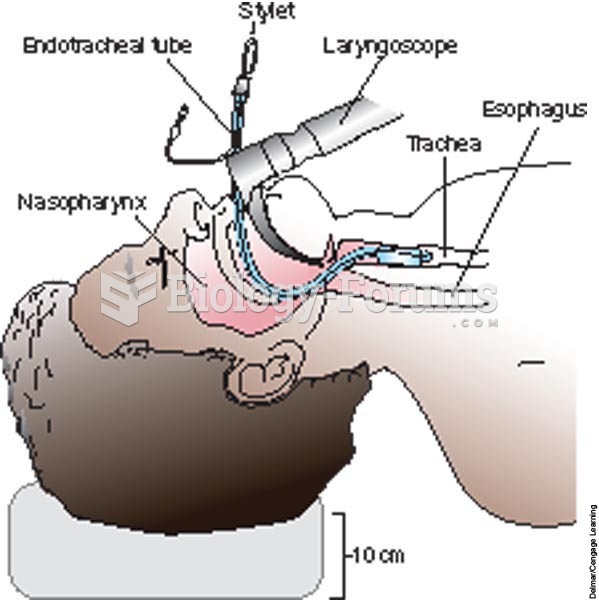 Placing an endotracheal tube in the trachea with direct visualization by laryngoscopy.
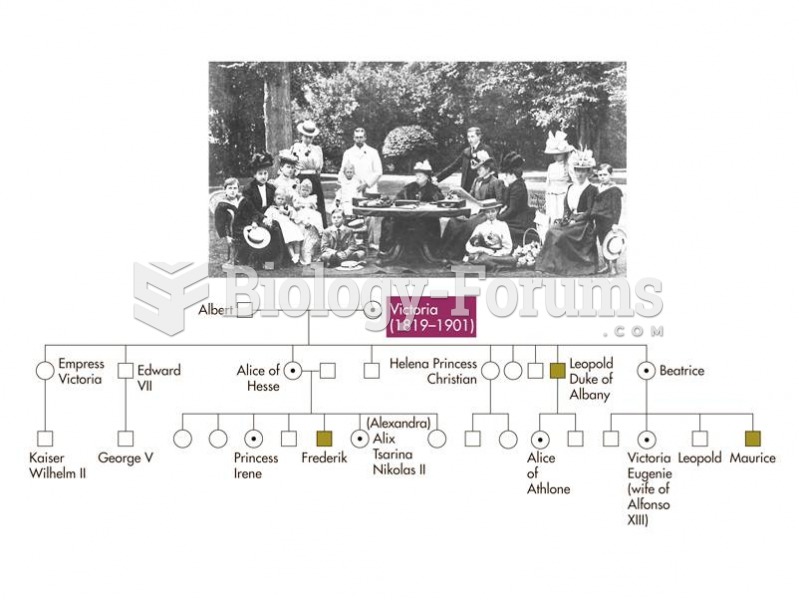 Queen Victoria and her family, and a pedigree showing the transmission of hemophilia in the British
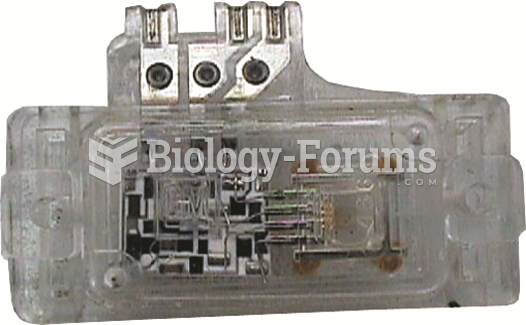 A plastic MAP sensor used for training purposes showing the electronic circuit board and electrical ...
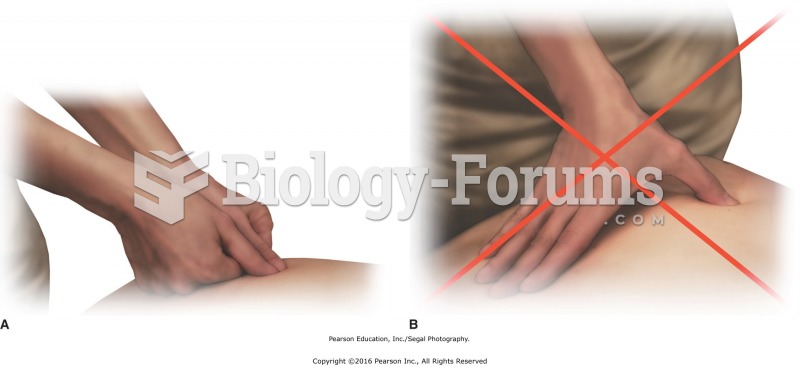 Stacking the joints. A. Correct thumb–wrist alignment for applying direct pressure. B. Incorrect ...
 Appear professional and organized for a job interview.
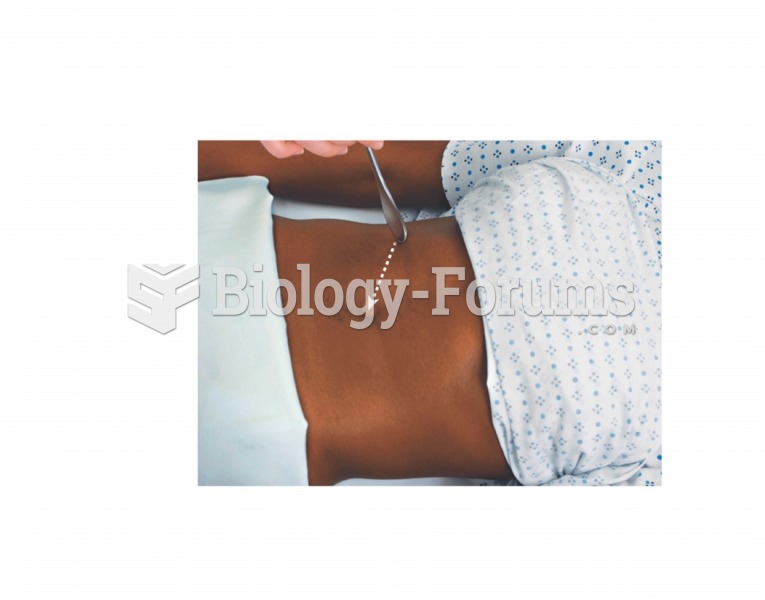 Abdominal reflex testing pattern