This topic contains a solution. Click here to go to the answer
|
|
|

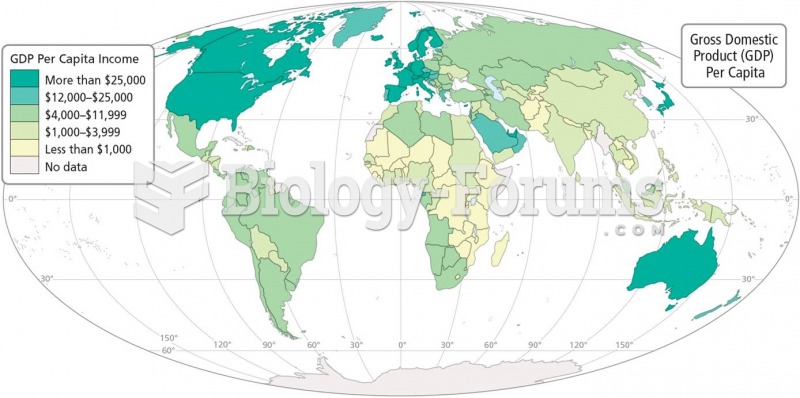 Child Labor Rates and GDP Worldwide
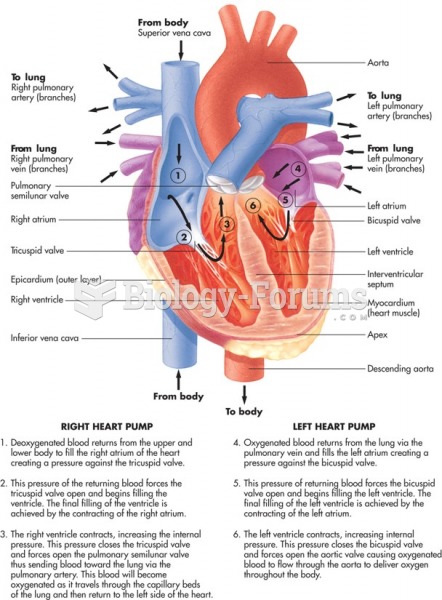 The flow of blood valves of the heart.
 Peak flow meter with marker for the zero position.
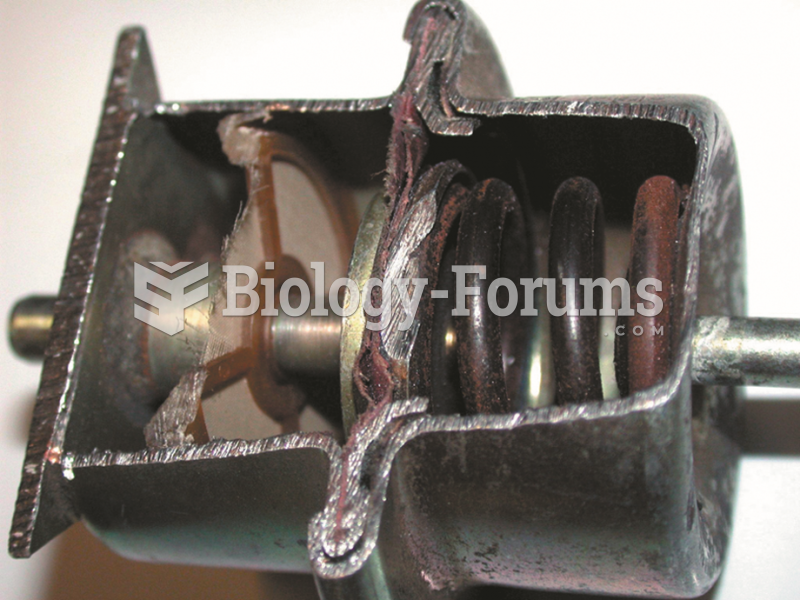 A lack of fuel flow could be due to a restricted fuel-pressure regulator. Notice the fine screen ...
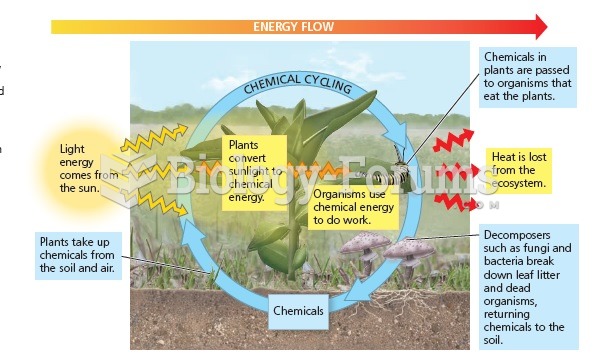 Energy flow and chemical cycling
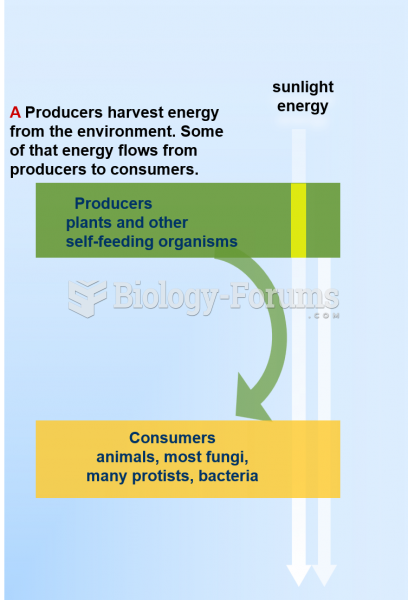 Animated The one-way flow of energy and cycling of materials in the world of life