This topic contains a solution. Click here to go to the answer
|
|
|

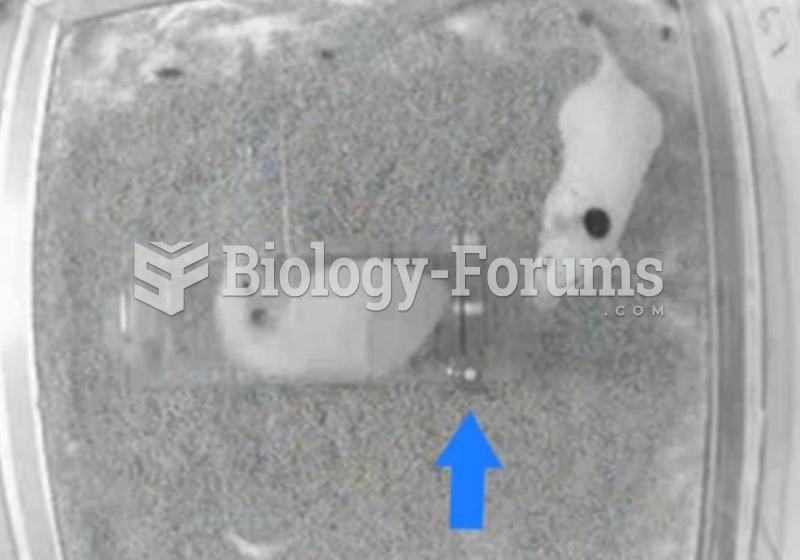 Rodents Show Empathy-Driven Behavior
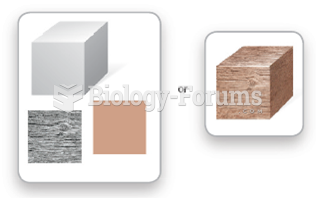 Working Memory Binds Visual Features into a Single Chunk
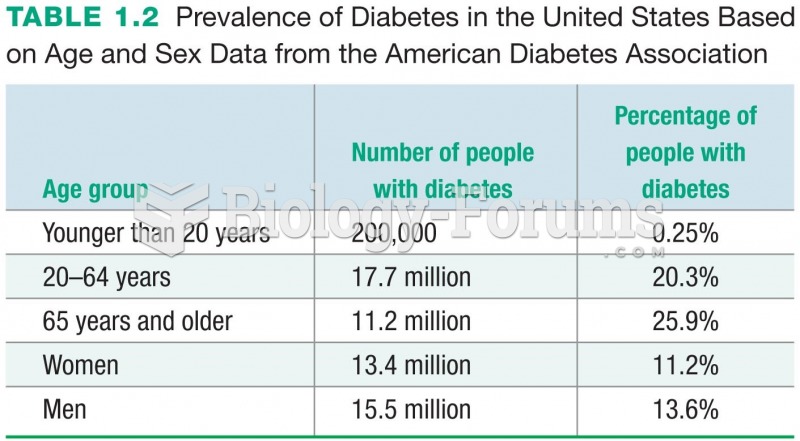 Prevalence of Diabetes in the United States Based on Age and Sex Data from the American Diabetes ...
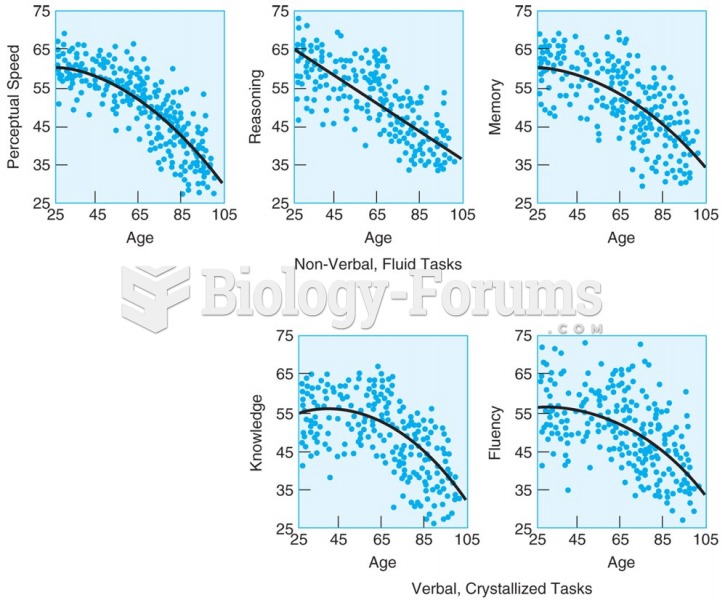 Adults in the Berlin Study of Aging show earlier declines on tests of nonverbal, fluid tasks (upper ...
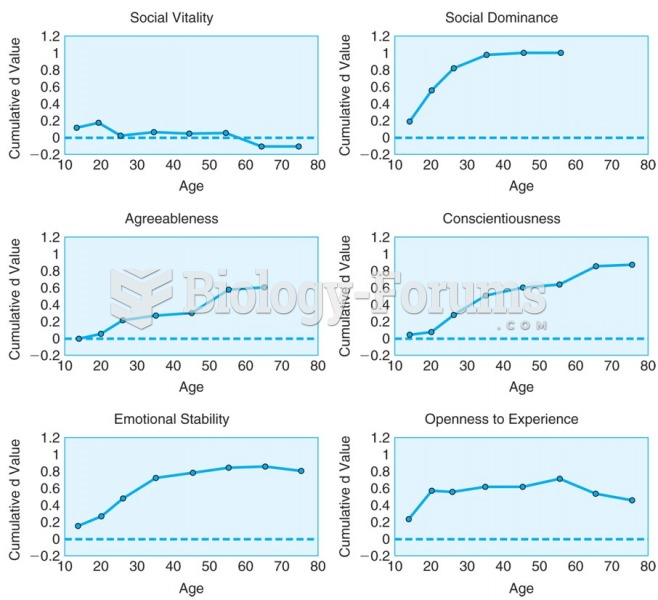 Cumulative change for six personality-trait domains across the life course show distinct patterns.
 A mobile weather station that can be used to gather current weather data at the scene of hazardous ...