This topic contains a solution. Click here to go to the answer
|
|
|

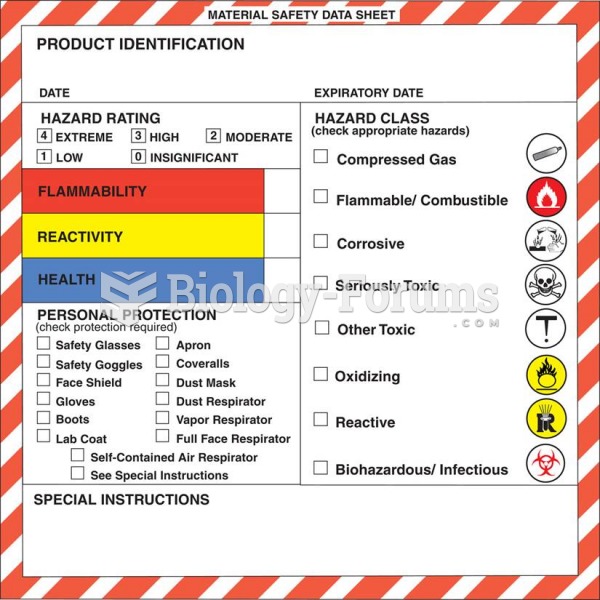 An example of a Material Safety Data Sheet (MSDS).
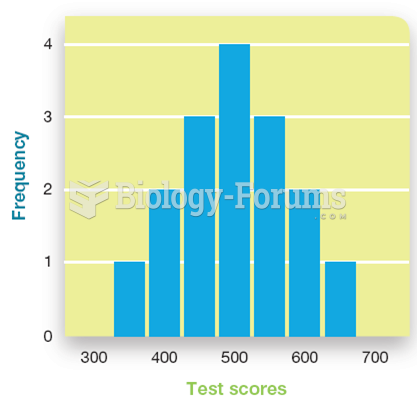 Graphing Psychological Data
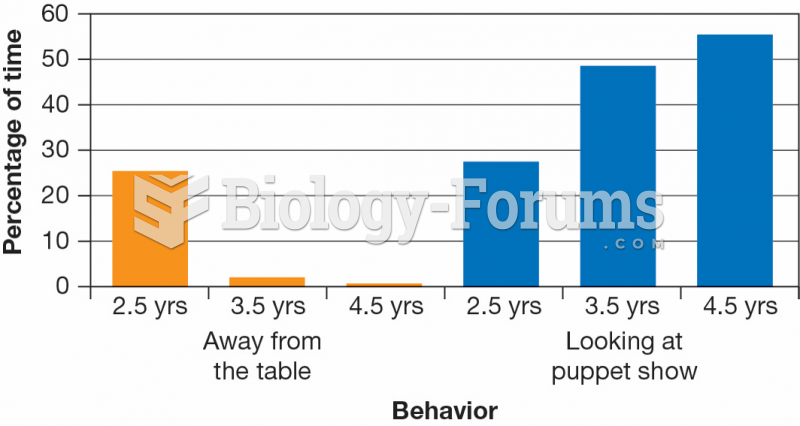 Age Differences in Attention to a Puppet Show Video
 Congruence among values, beliefs, and role requirements supports the development of empowered ...
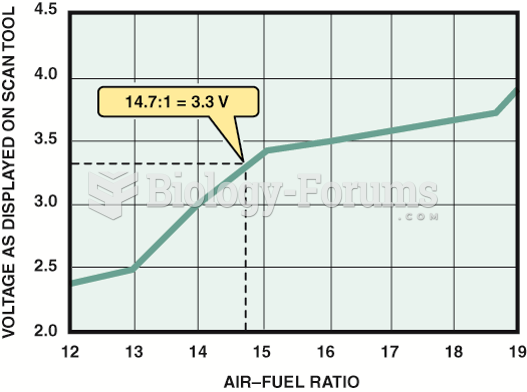 The scan tool can display various voltage but will often show 3.3 volts because the PCM is ...
 Calculus help: Show that y has three points of inflection and they all lie on...