|
|
|

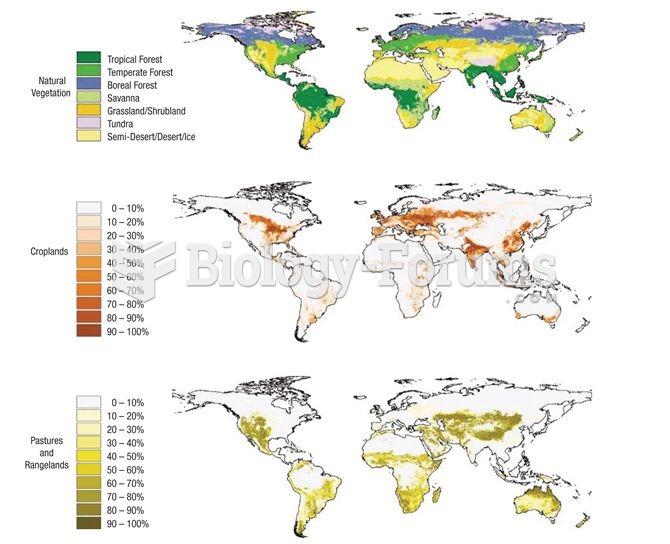 Extent of agricultural activity across the planet (data from Foley et al. 2005).
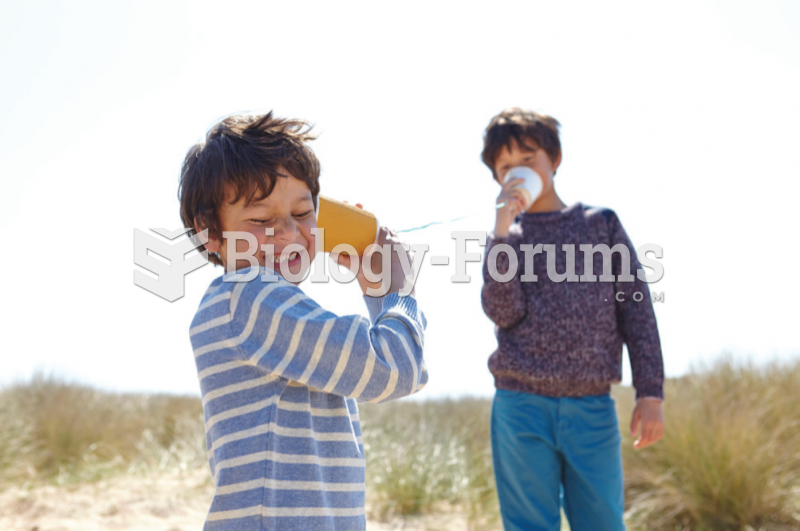 Sibling relationships can be intense, in terms of both having fun together and engaging in conflict.
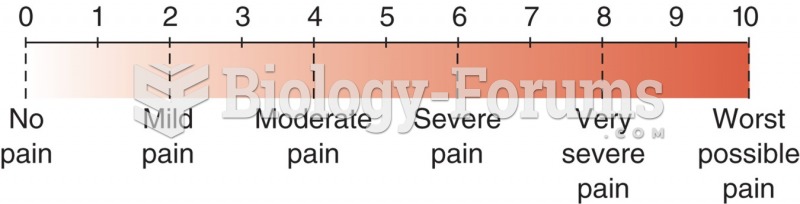 Numerical pain level chart with word modifiers.
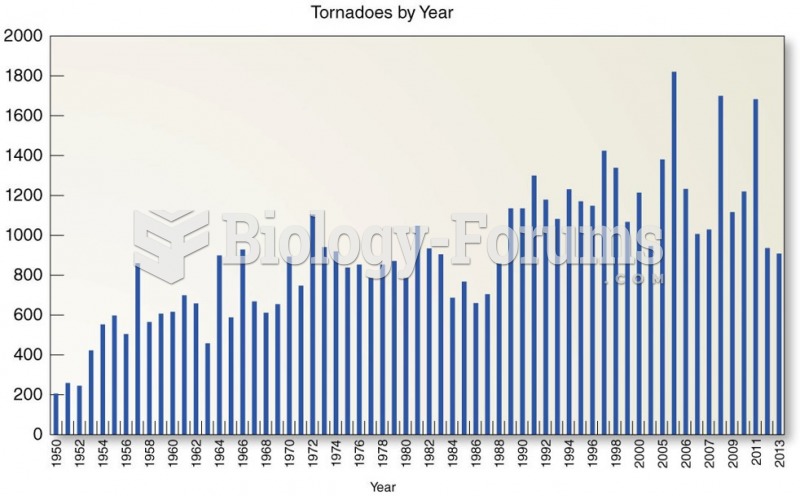 Trends in U.S. Tornado Occurrence
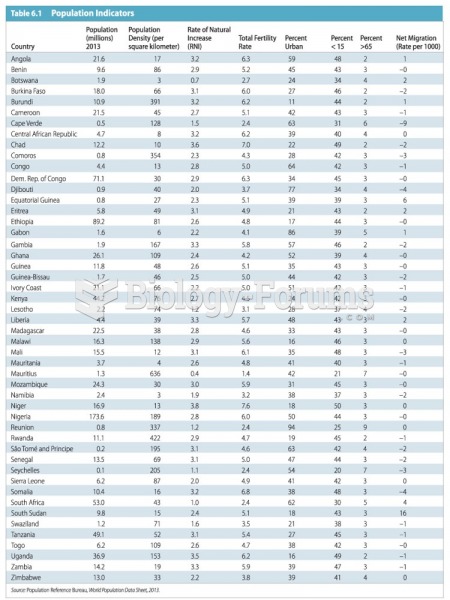 Demographic Trends and Debates
 Business Intelligence, Analytics, and Data Science: A Managerial Perspective, 4th Edition