|
|
|

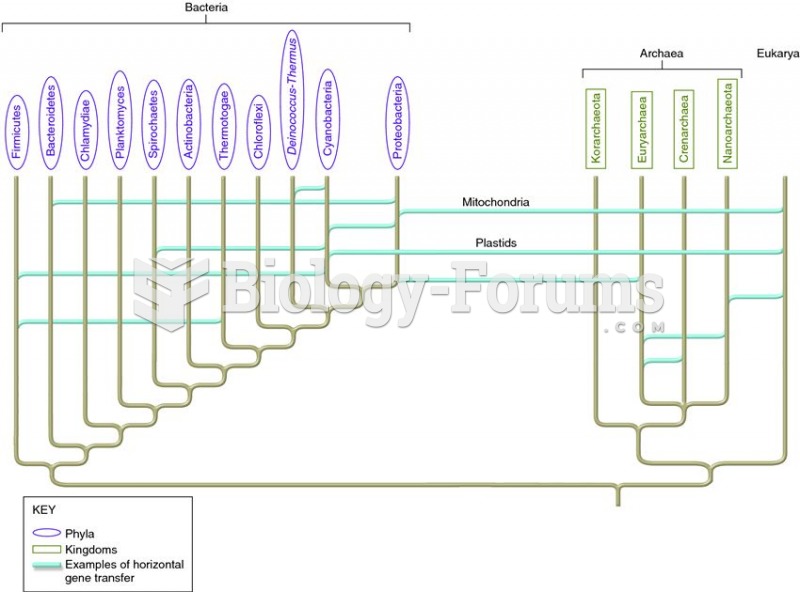 Relationships and diversification of the Bacteria and Archaea.
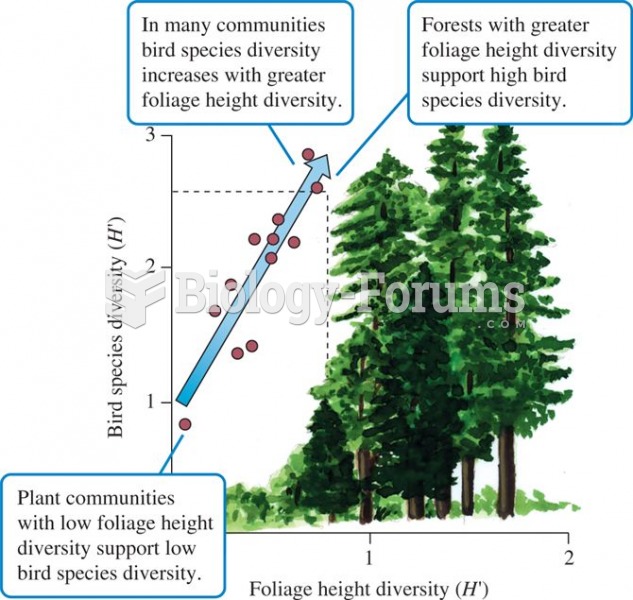 Foliage height diversity and bird species diversity (data from MacArthur and MacArthur 1961).
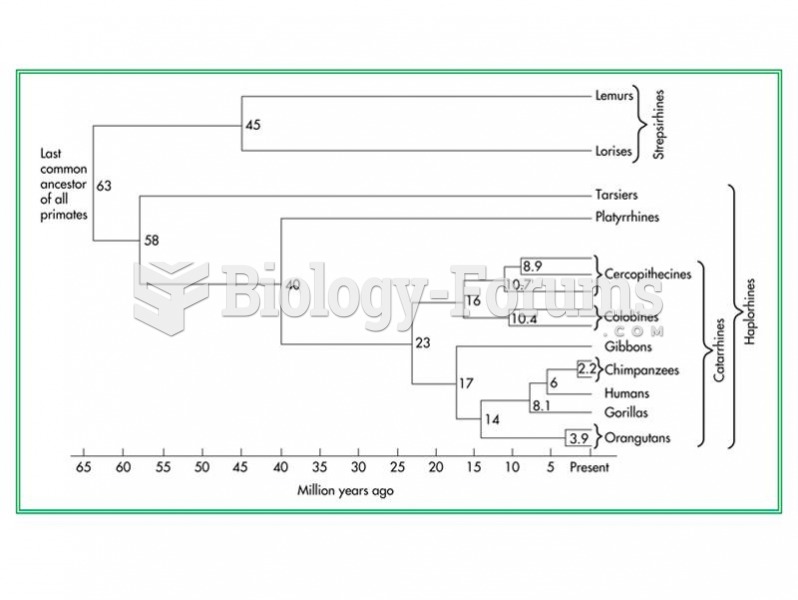 Relationships and dates divergence of living primate group based on molecular and DNA comparisons.
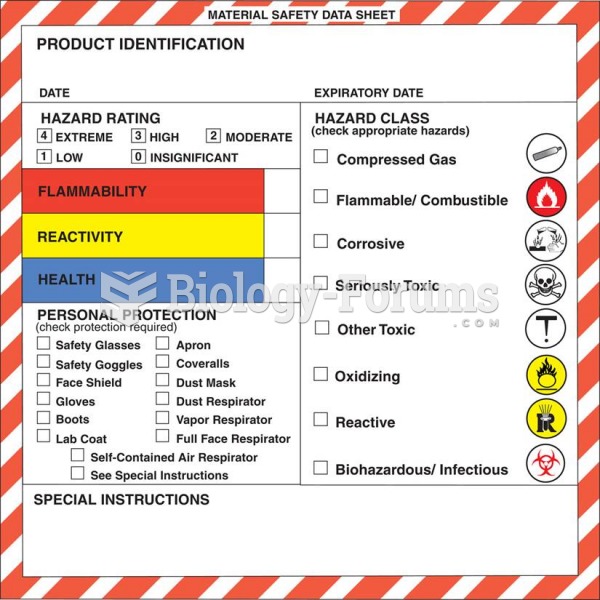 An example of a Material Safety Data Sheet (MSDS).
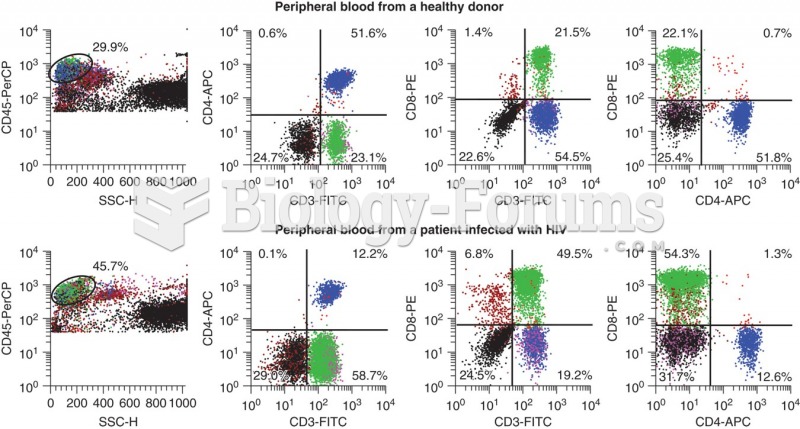 Flow data for a healthy donor (top panel) and a HIV positive patient. CD3 is a T-cell marker, CD4 is ...
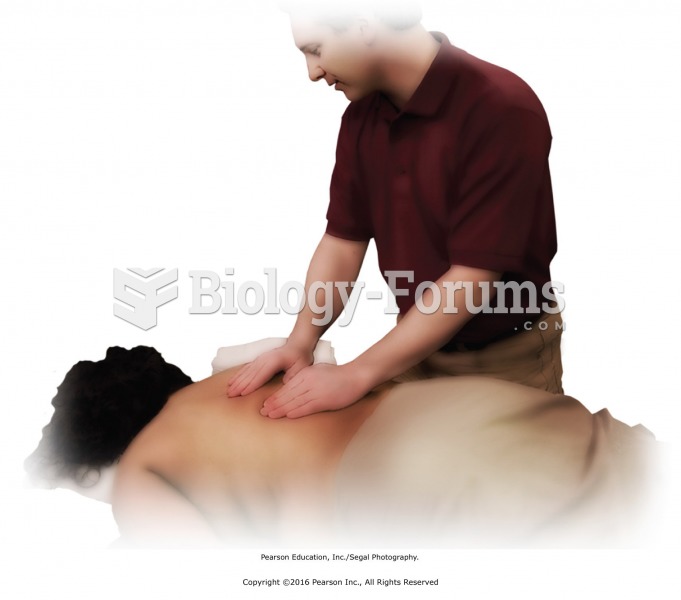 Prepare upper back for hot application. Undrape upper back. Check tissues visually and through ...