|
|
|

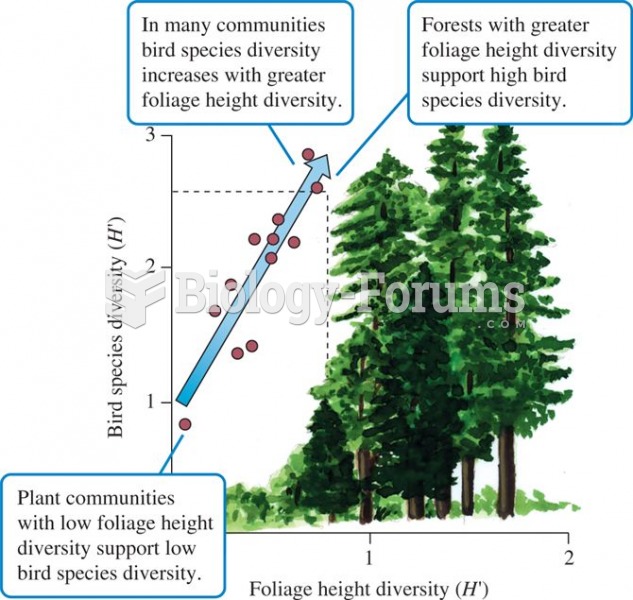 Foliage height diversity and bird species diversity (data from MacArthur and MacArthur 1961).
 Bronfenbrenner was interested in bidirectional relationships between different levels of the ...
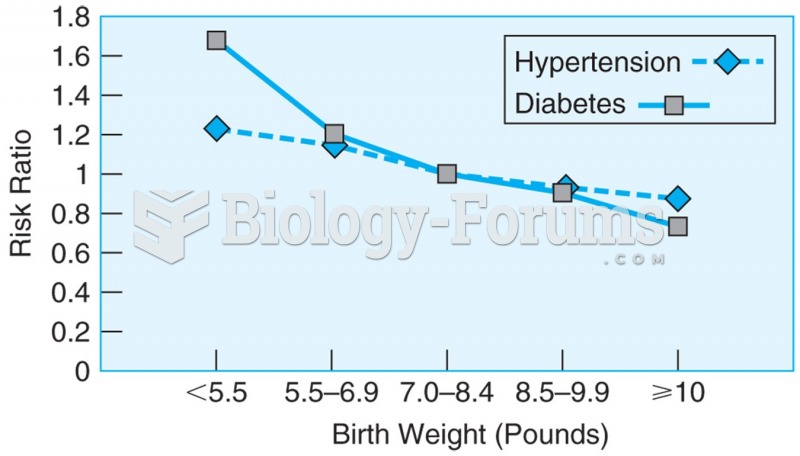 Data from more than 22,000 men over the age of 40, showing the relationship between birth weight and ...
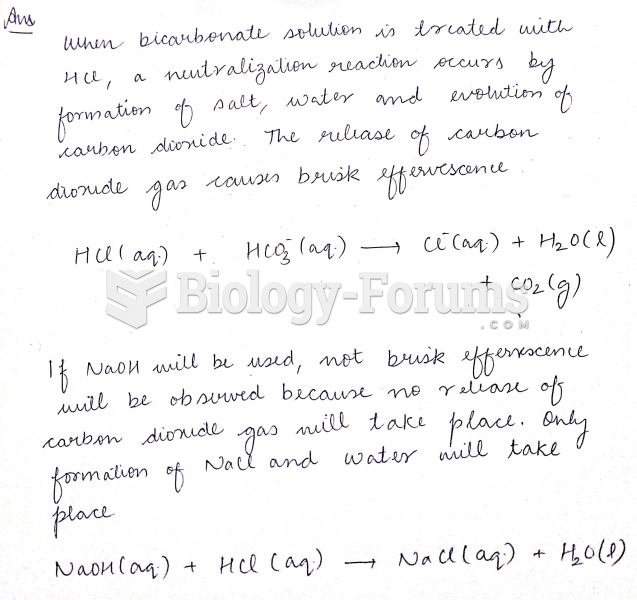 Lab: Mass Relationships in Chemical Reaction
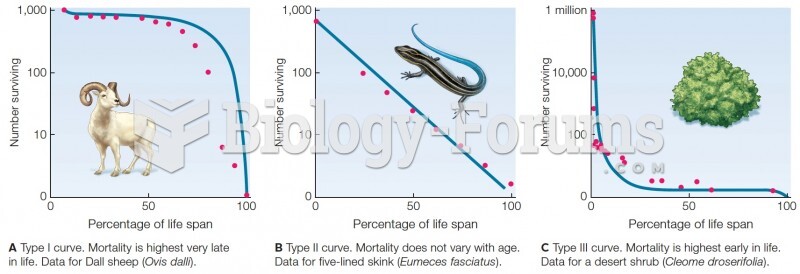 Survivorship curves. Blue lines are theoretical curves. Red dots are data from field studies.
 Ribosome structure and tRNA-binding sites interpreted from cryo-EM–generated data