|
|
|
To prove that stomach ulcers were caused by bacteria and not by stress, a researcher consumed an entire laboratory beaker full of bacterial culture. After this, he did indeed develop stomach ulcers, and won the Nobel Prize for his discovery.
As many as 28% of hospitalized patients requiring mechanical ventilators to help them breathe (for more than 48 hours) will develop ventilator-associated pneumonia. Current therapy involves intravenous antibiotics, but new antibiotics that can be inhaled (and more directly treat the infection) are being developed.
Lower drug doses for elderly patients should be used first, with titrations of the dose as tolerated to prevent unwanted drug-related pharmacodynamic effects.
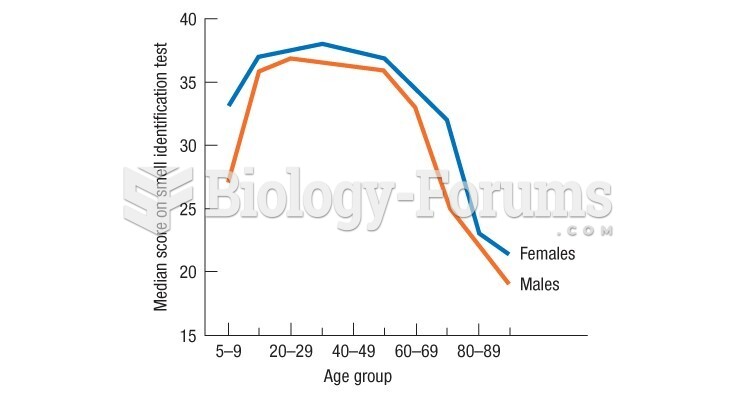
Pregnant women usually experience a heightened sense of smell beginning late in the first trimester. Some experts call this the body's way of protecting a pregnant woman from foods that are unsafe for the fetus.
After a vasectomy, it takes about 12 ejaculations to clear out sperm that were already beyond the blocked area.


