|
|
|

 Astronomers identified 12-billion-year-old white dwarf stars only 100 light years away from Earth
 Platycnemididae are a family of damselfly called white-legged damselflies.
 Human Memorabilia in Space
 Frederick Douglass, having escaped from slavery in 1836, attracted large audiences as an antislavery
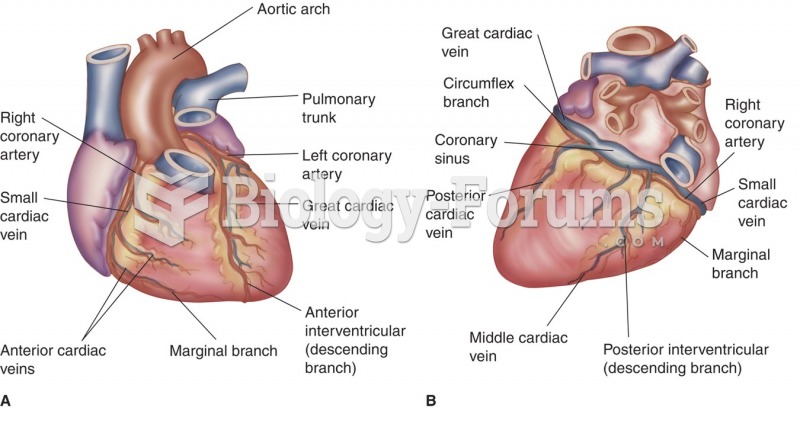 Coronary circulation: (A) coronary vessels portraying the complexity and extent of the coronary ...