Bar charts used to illustrate the relationship between two or more similar variables are called comparative bar charts.
Indicate whether the statement is true or false
Question 2
Lidia deposits 900 at the END of each year for 9 years in a savings account. The account pays 8 interest, compounded annually. Lidia calculates that the future value of the ordinary annuity is 11,238.80. What would be the future value if deposits are made at the BEGINNING of each period rather than the END?
A) 11,238.80
B) 12,137.90
C) 12,960.00
D) 13,037.91

 Mechanism of transport by a transporter, also called a carrier.
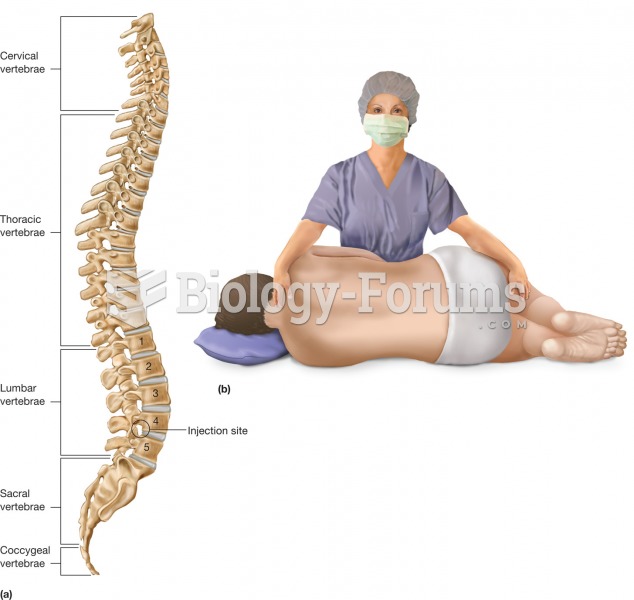 Lumbar puncture. Abbreviated LP, the lumbar puncture is a common procedure that withdraws cerebrospi
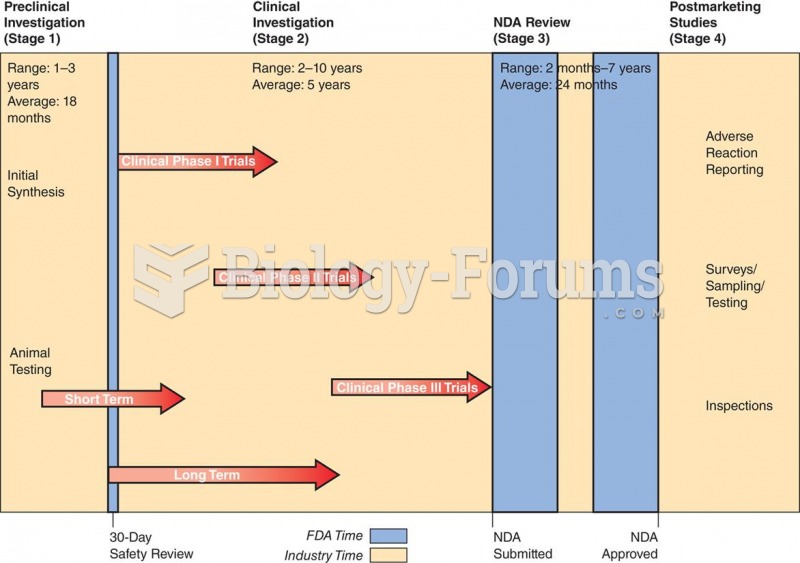 The approval of a new drug is a four-stage process: (1) preclinical investigation, (2) clinical inve
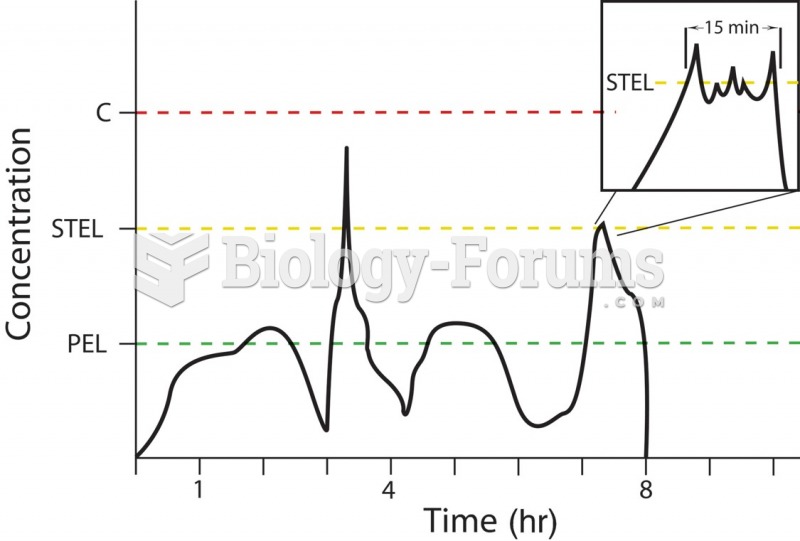 The relationship between the permissible exposure limit (PEL), the short-term exposure limit (STEL), ...
 Exterior View of Tholos, The So-called Treasury of Atreus
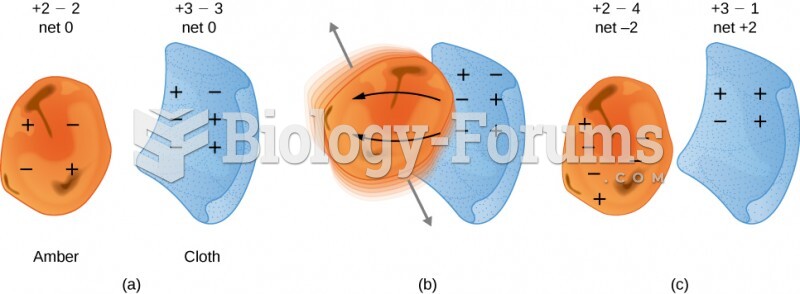 Physics - Illustrate how you understand charging by rubbing or friction using the guide ...