This topic contains a solution. Click here to go to the answer
|
|
|

 Performing a Spirometry Test to Measure Forced Vital Capacity
 Using a gauge that measures vacuum in units of inches of water to test the vacuum at the dipstick ...
 Different ways to test hypotheses
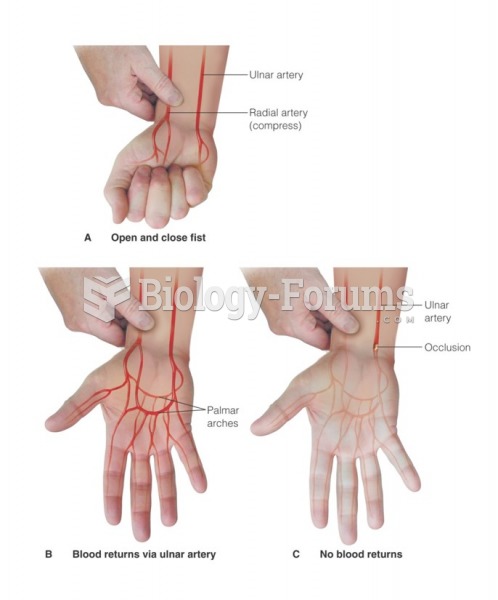 Allen’s test
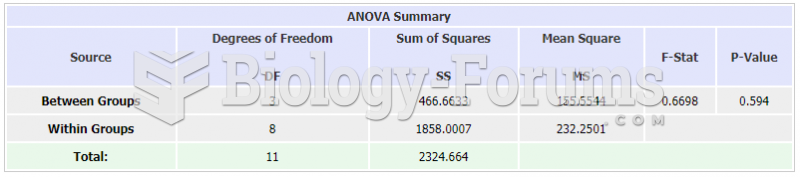 ANOVA Table
 A test field of GM papaya