|
|
|

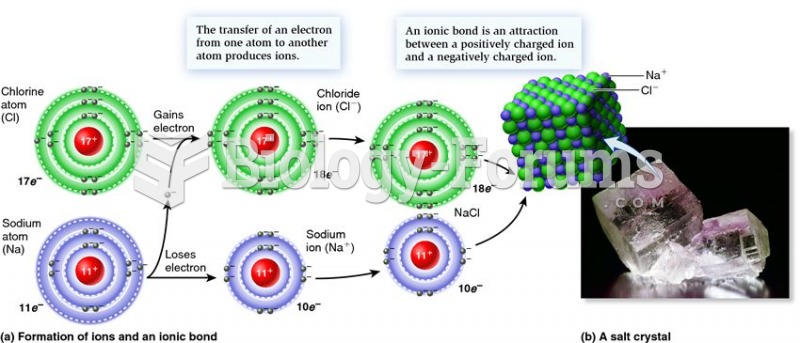 Ionic bonding in table salt (NaCl)
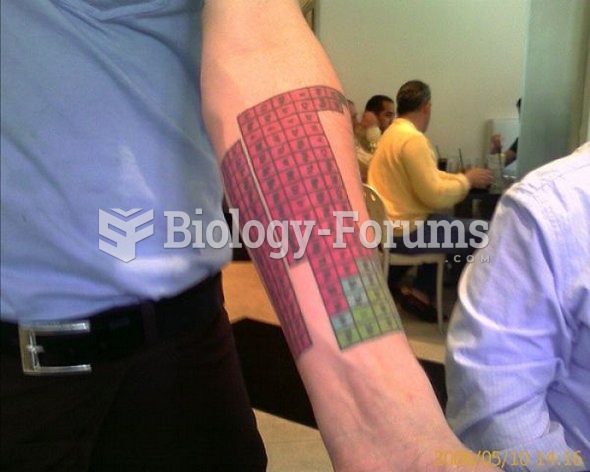 Periodic Table Tattoo
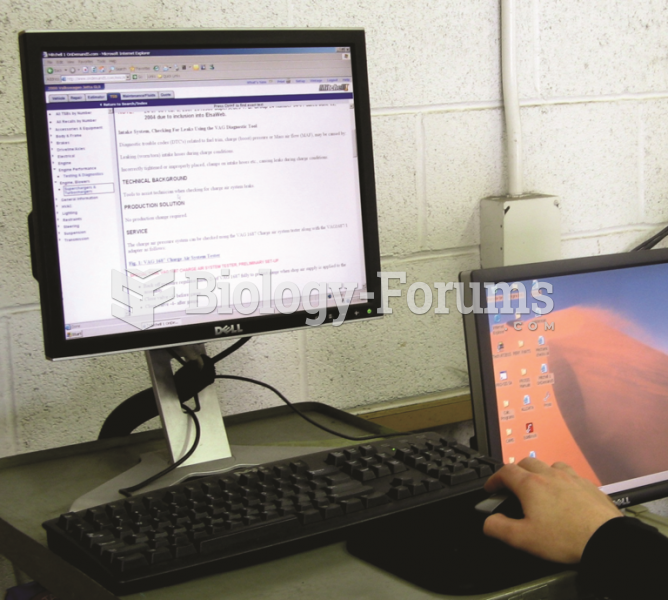 Electronic service information is available from aftermarket sources, such as All-Data and ...
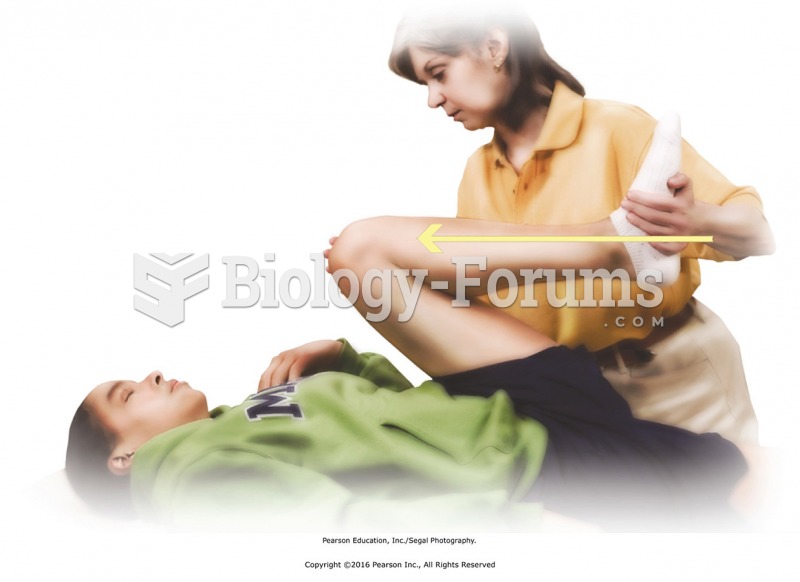 Apply knee to chest stretch for posterior hip and leg muscles. Facing the table directly, place one ...
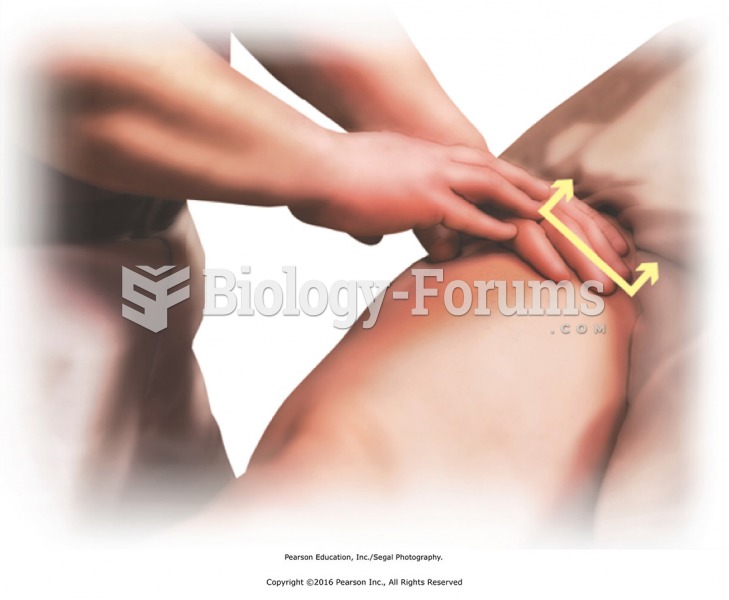 Clear the inguinal catchment area. Face the side of the table at recipient’s waist. Place your ...
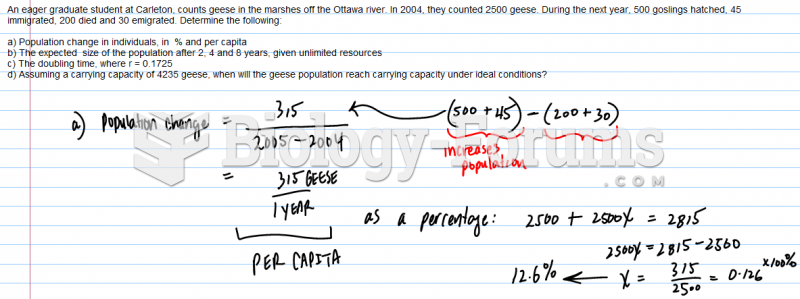 An eager graduate student at Carleton, counts geese in the marshes off the Ottawa river. In ...