In a scatter diagram, data are represented as:
a. dots which allow us to readily see the shape of the distribution as well as the high and low values.
b. frequencies according to the relative length of a set of rectangles.
c. a subset of the original digits as class descriptors.
d. a circular display divided into sections based on the number of observations within the segments.
e. pairs of known values of two variables, one being referred to as independent and the other, dependent.
Question 2
Which of the following is not a guideline for constructing a frequency distribution?
a. If possible, open-end classes should be avoided.
b. The set of classes must be mutually exclusive and exhaustive.
c. Whenever possible, the classes should have equal width.
d. Whenever possible, class widths should be round numbers.
e. All of these are guidelines for constructing a frequency distribution.

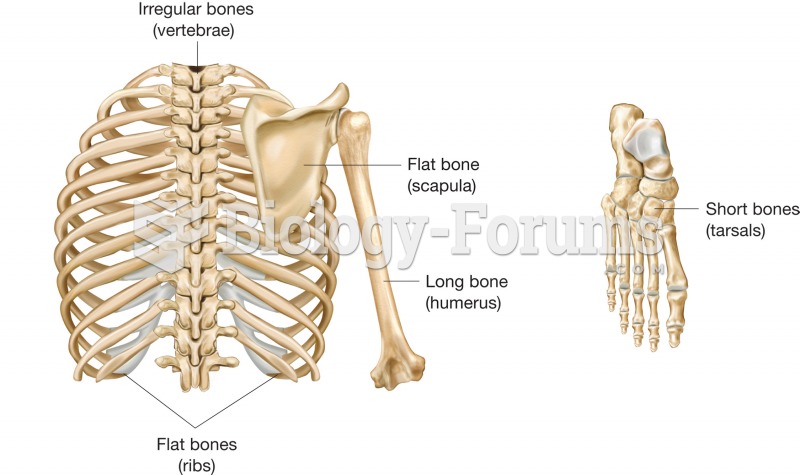 Classification of bones by shape.
 Anatomy Diagram Of Human Body
 diagram
 Acquiring Weather Data
 Basic Marketing Research: Using Microsoft Excel Data Analysis
 Gamete genotype frequencies calculated from genetic linkage data