This topic contains a solution. Click here to go to the answer
|
|
|

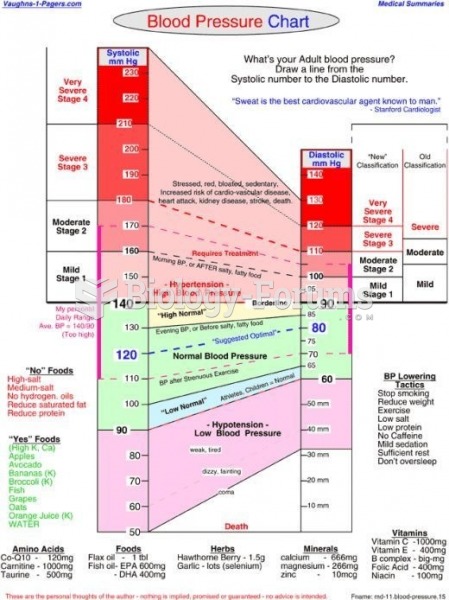 Blood Pressure Chart
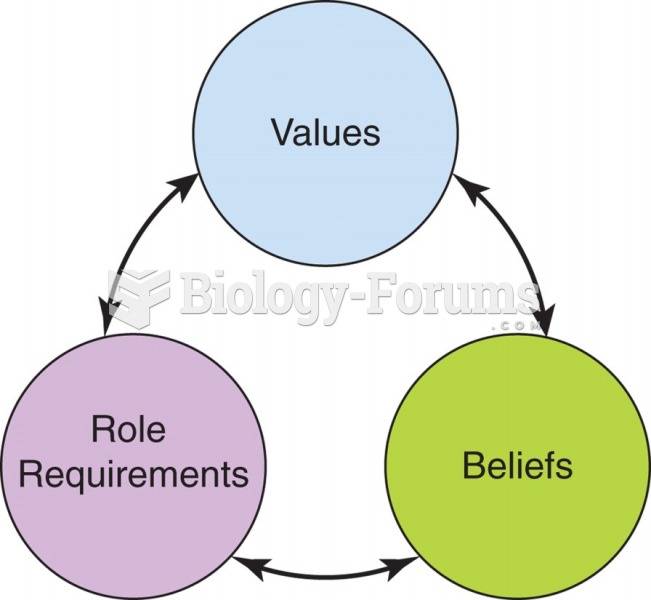 Congruence among values, beliefs, and role requirements supports the development of empowered ...
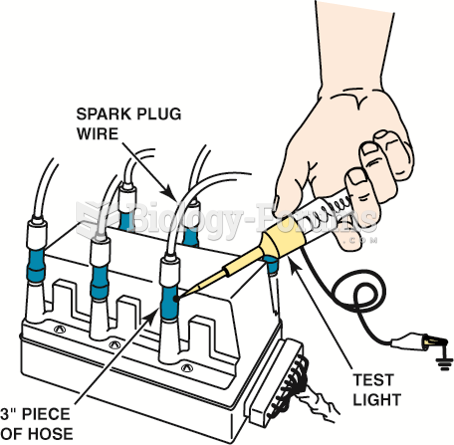 Using a vacuum hose and a test light to ground one cylinder at a time on a distributorless ignition ...
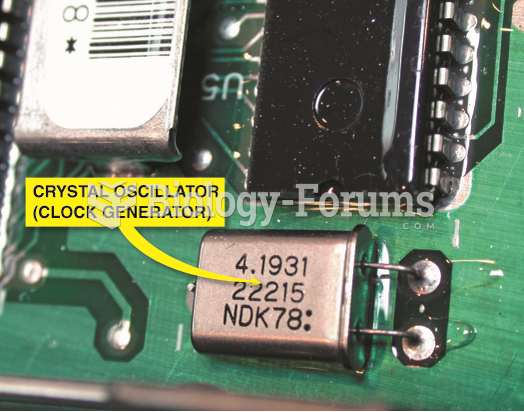 The clock generator produces a series of pulses that are used by the microprocessor and other ...
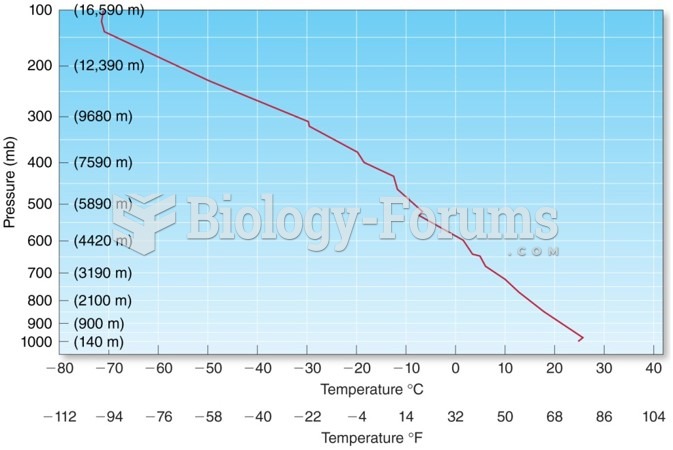 Thermodynamic Diagrams and Vertical Temperature Profiles
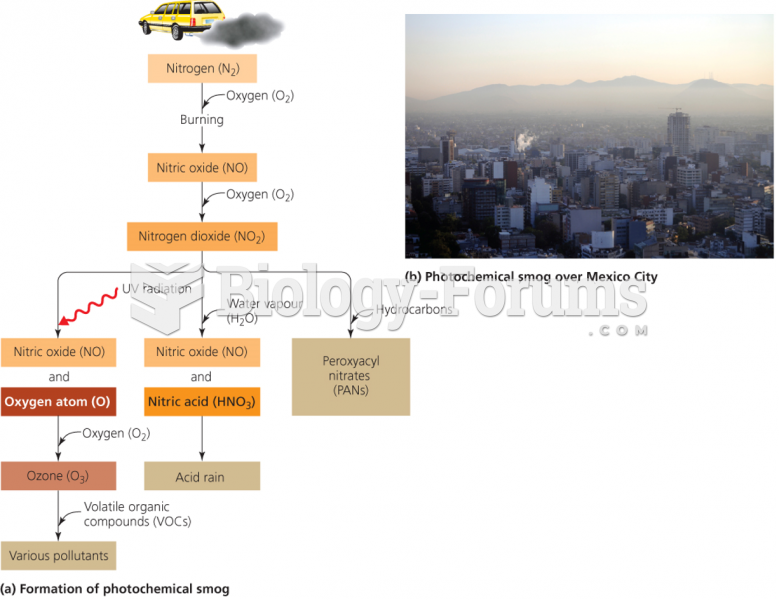 Photochemical smog is produced by a complex series of reactions