This topic contains a solution. Click here to go to the answer
|
|
|

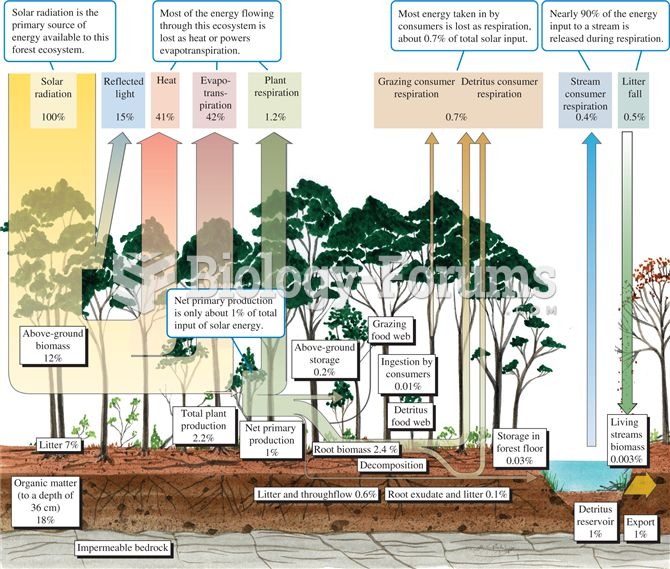 Energy budget for a temperate deciduous forest (data from Gosz et al. 1978).
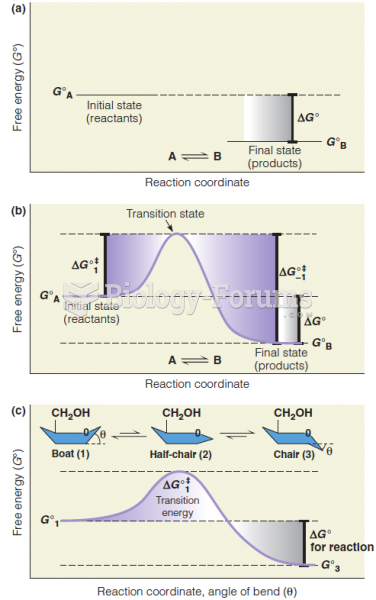 Free energy diagrams for the simple reaction A ----> B
 Kahan (Last Year)
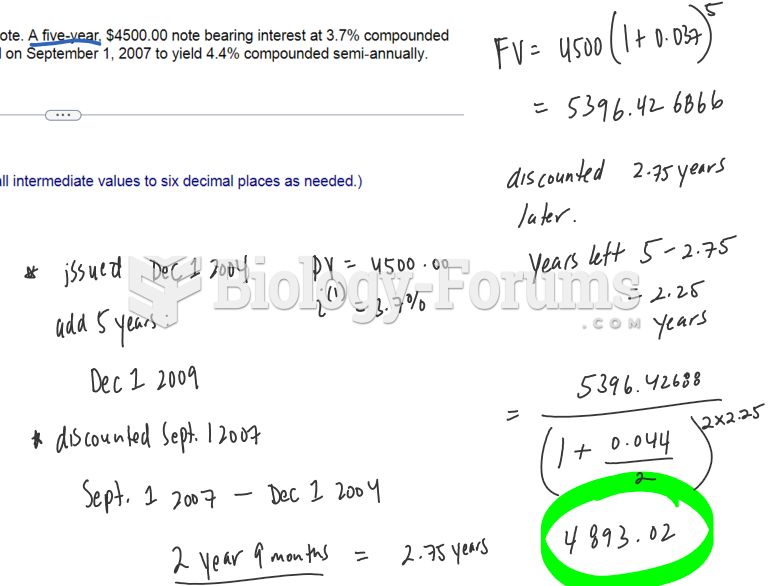 Find the proceeds of the following promissory note. A five-year, $4500.00 note bearing interest ...
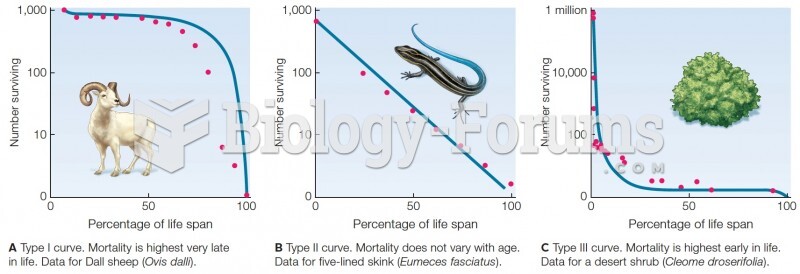 Survivorship curves. Blue lines are theoretical curves. Red dots are data from field studies.
 Chi-Square Analysis of Mendel’s Trihybrid-Cross Data