Answer to Question 1
The control limits on an SPC chart are typically set at the 3-sigma level. This means that if the process remains unchanged, approximately 99.7 percent of the observations will fall within the control limits. Thus, under normal circumstances it would be most unusual for a measurement to fall outside the upper or lower control limits if nothing has changed. The signals that something has changed are:
1. one or more points outside the control limits
2. nine or more points in a row above or below the center line
3. six or more points moving in the same direction (up or down).
These limits are all set such that the probability of one of these events happening if the process is actually unchanged (in control) is very small. Therefore, if such an event exists, we should conclude that something has changed and the process is out of control. These rules guard against the Type I errorsaying the process is out of control when it isn't.
Answer to Question 2
C

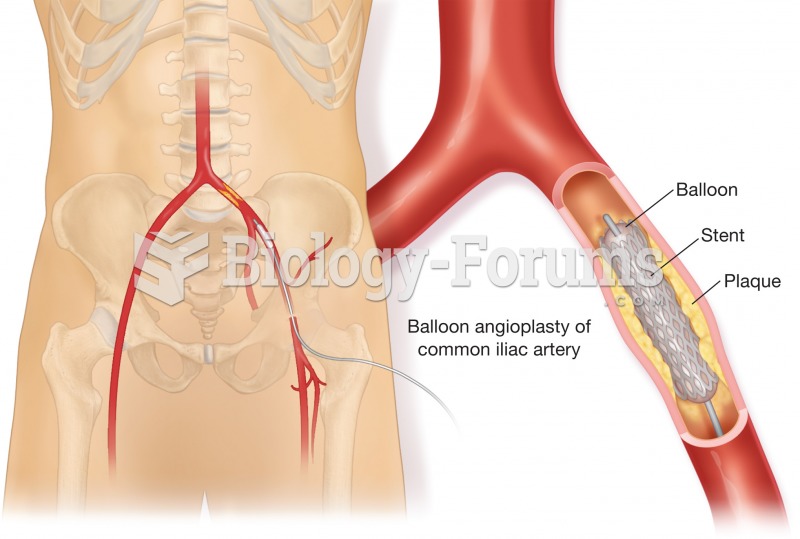 Angioplasty. One form is called balloon angioplasty, shown here. A balloon catheter is threaded into
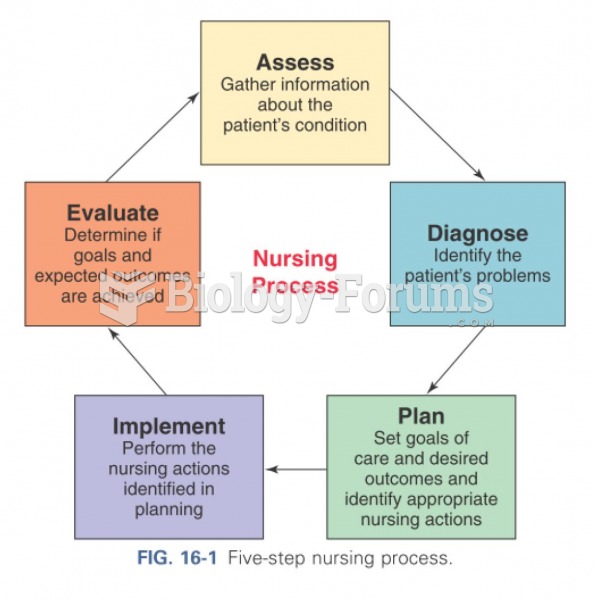 Five step nursing process
 Fossil remains of anatomically modern humans from the Czech Republic and from China (center crania)
 Deviancy training is a process by which antisocial peers encourage antisocial talk among friends, ...
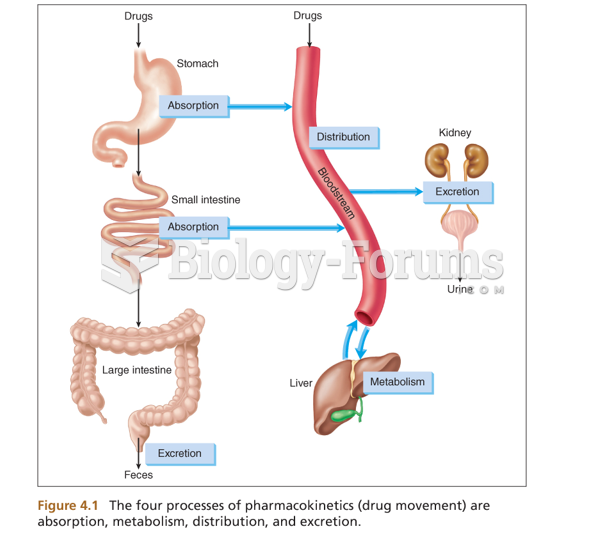 The process of pharmacokinetics
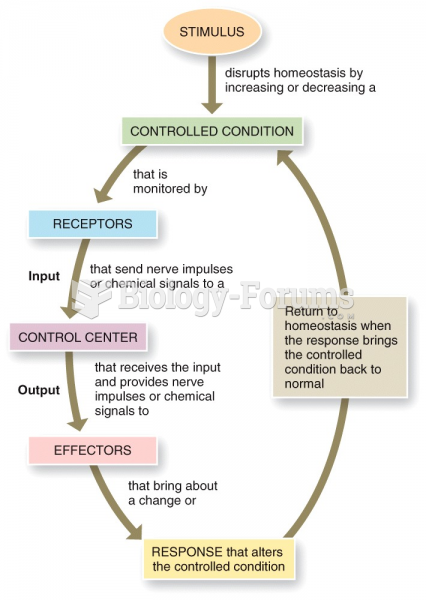 Control of Homeostasis