The following data represents the number of Sony TVs sold per day at a particular Costco over a random sample of five business days.
9 2 7 7 5
The mean of this sample is ________.
A) 5.7
B) 6.0
C) 6.4
D) 6.6
Question 2
The following distribution shows the frequency of daily revenue for an Italian restaurant in Wilmington, Delaware.
Revenue Frequency
Under 2,000 18
2,000 to under 4,000 10
4,000 to under 6,000 26
6,000 to under 8,000 14
8,000 to under 10,000 8
Over 10,000 4
How many business days does this frequency distribution represent?
A) 100
B) 80
C) 32
D) 18

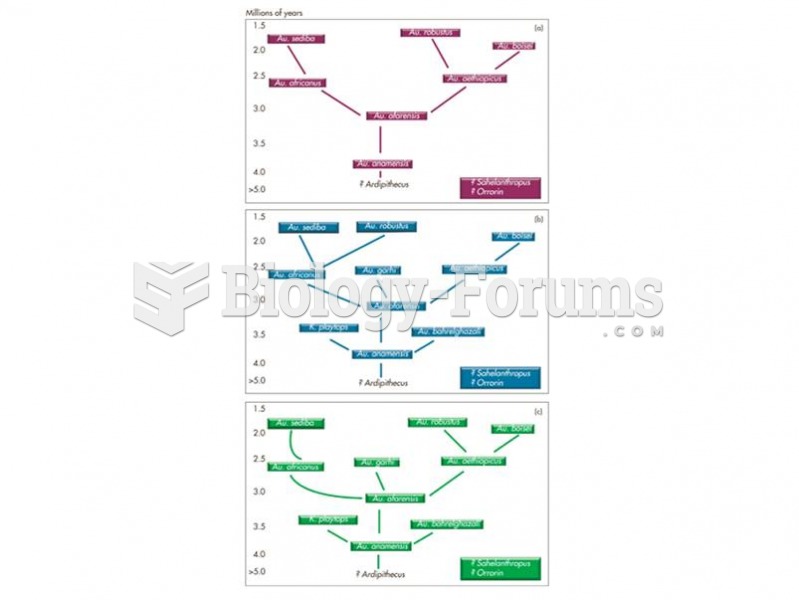 Three possible phylogenies for the australopithecines with Au. anamnesis as the stem ancestor and re
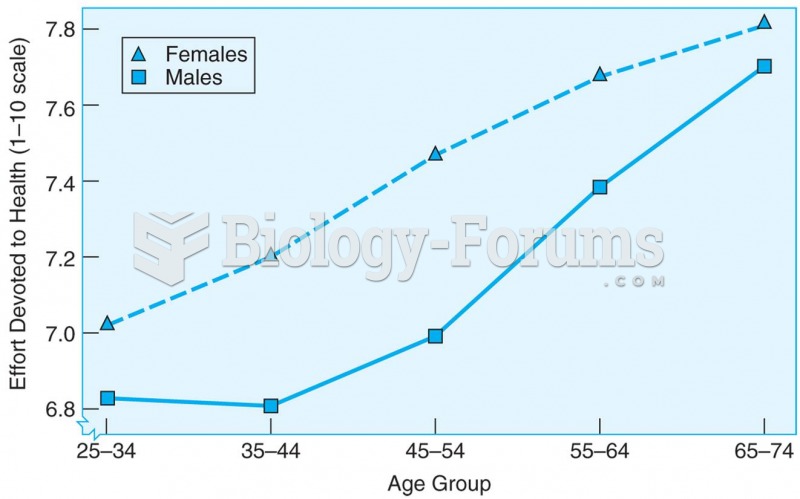 Cross-sectional data showing that the amount of effort spent on personal health care increases with
 The vehicle identification number (VIN) is visible through the base of the windshield and on a ...
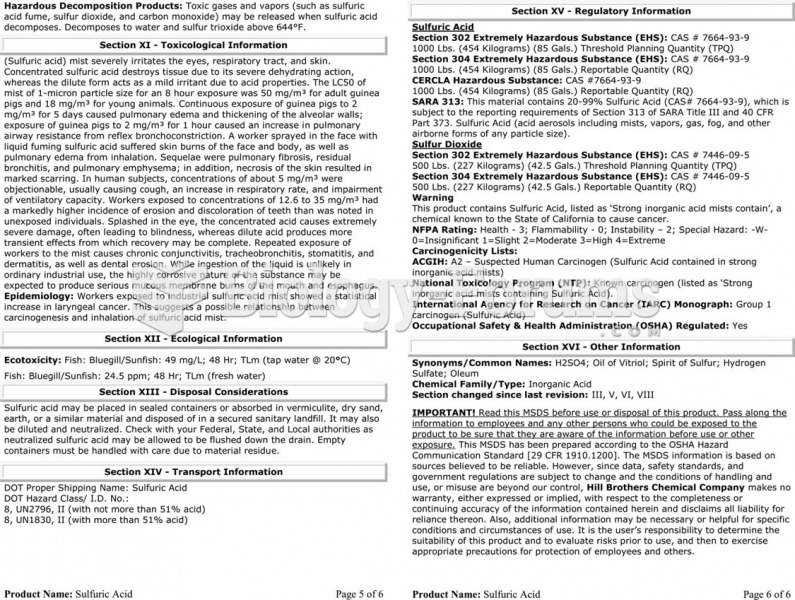 The material safety data sheet (MSDS) for sulfuric acid showing the detailed technical information ...
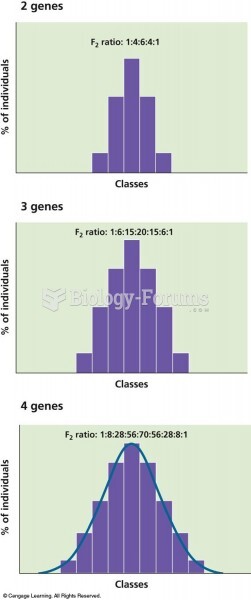 The number of phenotypic classes in the F2 generation increases as the number of genes controlling t
 What is the minimum number of straight, continuous lines that are necessary to c