|
|
|

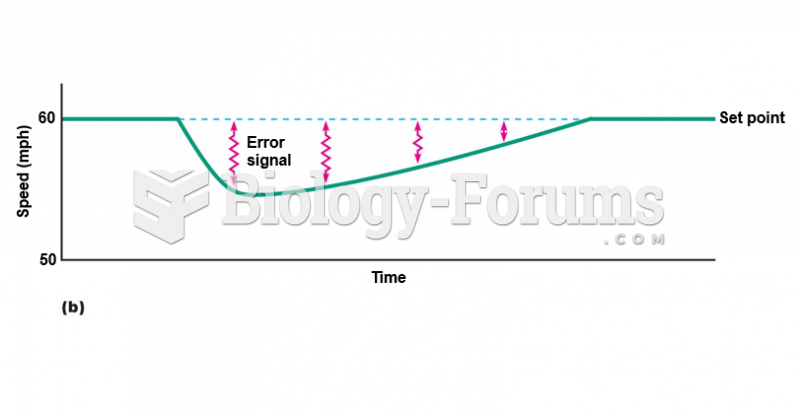 Negative feedback control of a regulated variable.
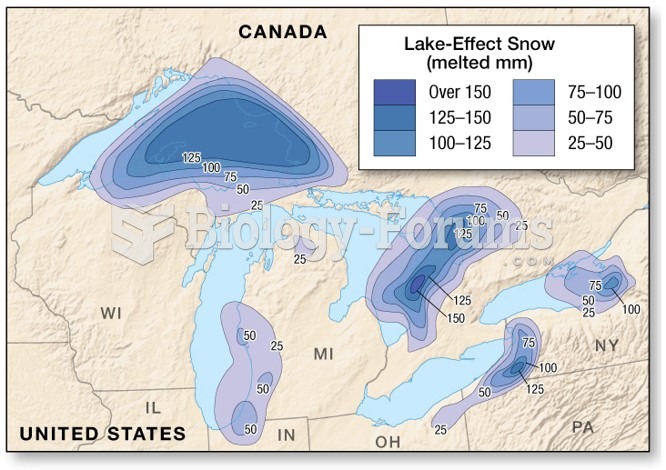 Distribution and Forms of Precipitation: Snow
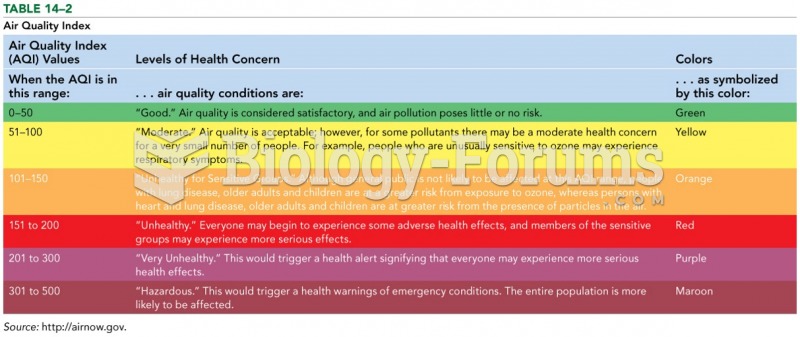 Air Quality Index
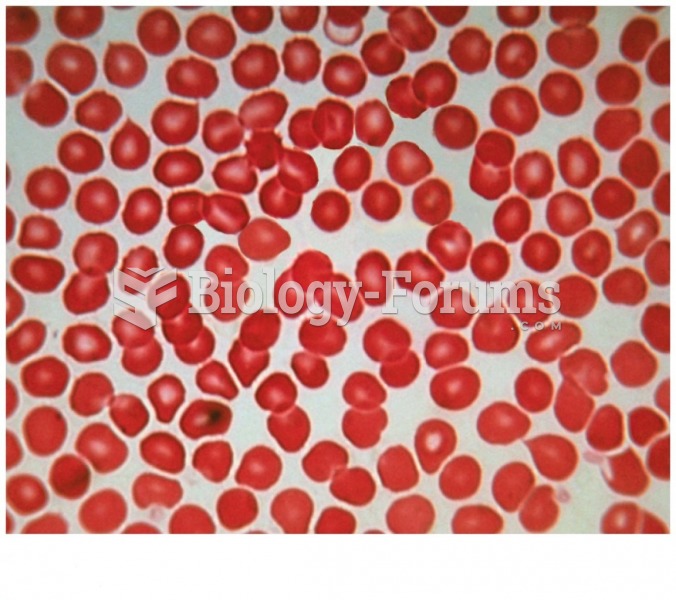 Normal Red Blood Cells
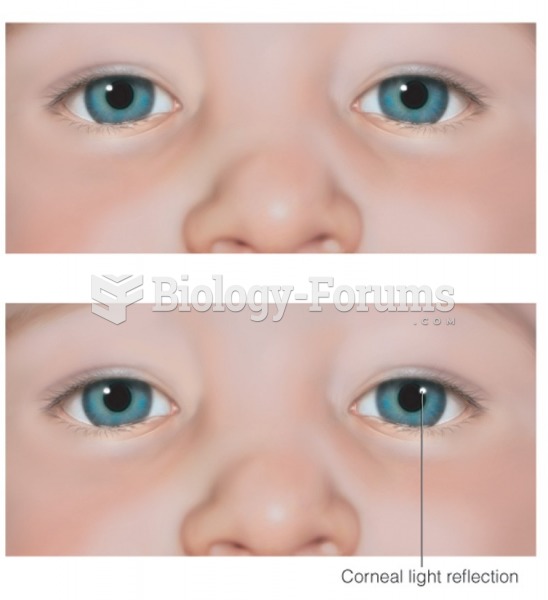 Normal and abnormal corneal light reflection test
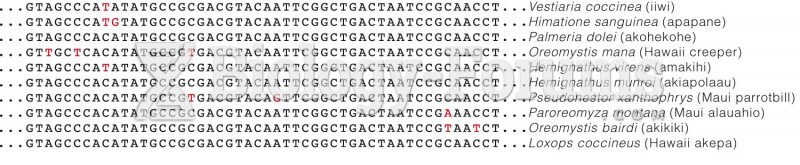 Cladogram Based On DNA Sequence