This topic contains a solution. Click here to go to the answer
|
|
|

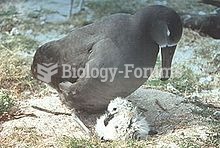 Albatrosses brood young chicks until they are large enough to thermoregulate.
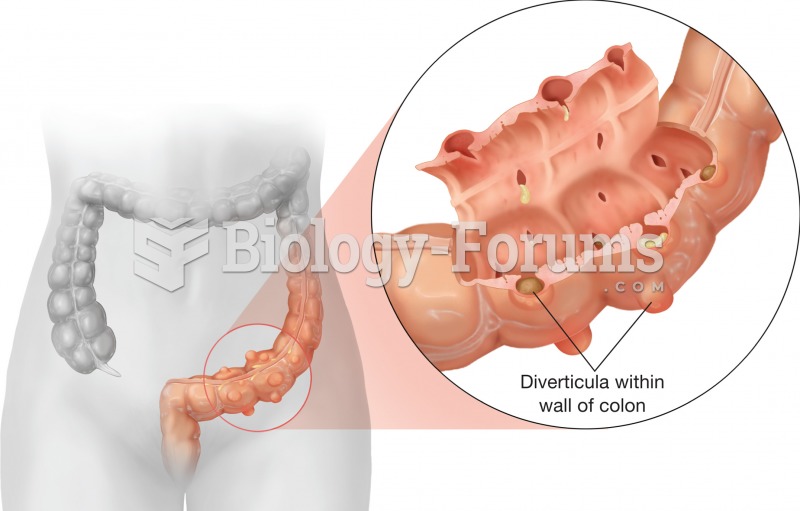 Diverticulosis. It is the presence of abnormal pouches in the wall of the large intestine (diverticu
 Large-Flowered Leafcup
 Large Yellow Wood Sorrel
 The Distribution of Dominant and Minority Groups
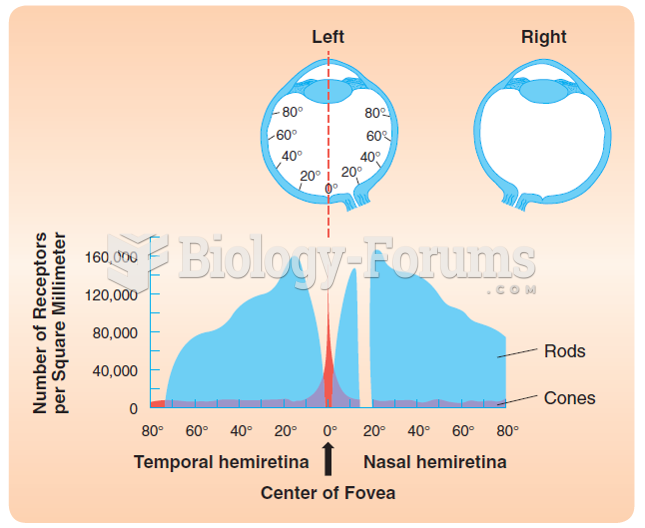 The distribution of cones and rods over the human retina. The figure illustrates the number of cones ...