This topic contains a solution. Click here to go to the answer
|
|
|

 The central and peripheral nervous system
 Views of the Milky Way’s Central Regions
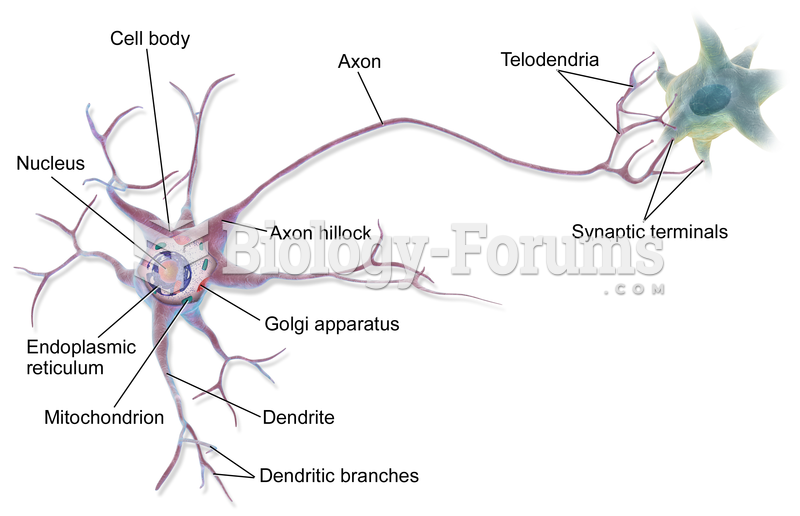 Graphical Multipolar Neuron
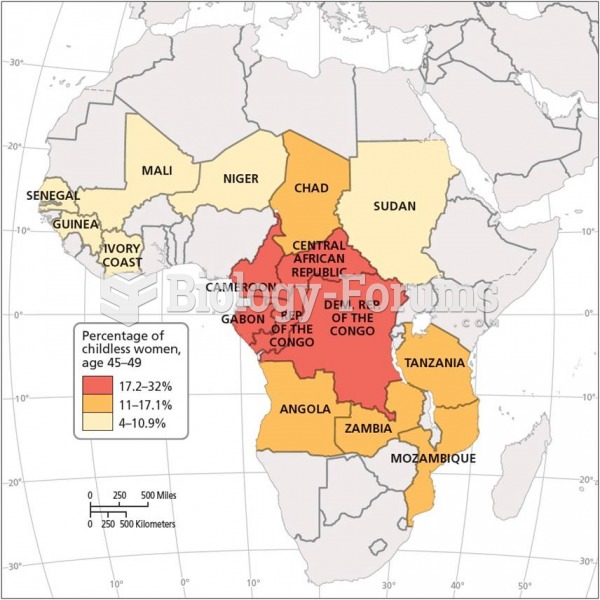 The “Infertility Belt” In certain countries in Central Africa, infertility rates are as high as 30%
 Rem Koolhaas and Ole Scheeren, OMA, New Headquarters, Central Chinese Television (CCTV), Beijing, ...
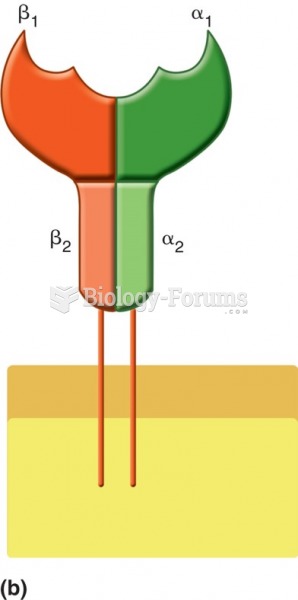 Schematic representation of MHC class II molecule, consisting of 2 α-domains and 2 β-domains, the ...