This topic contains a solution. Click here to go to the answer
|
|
|

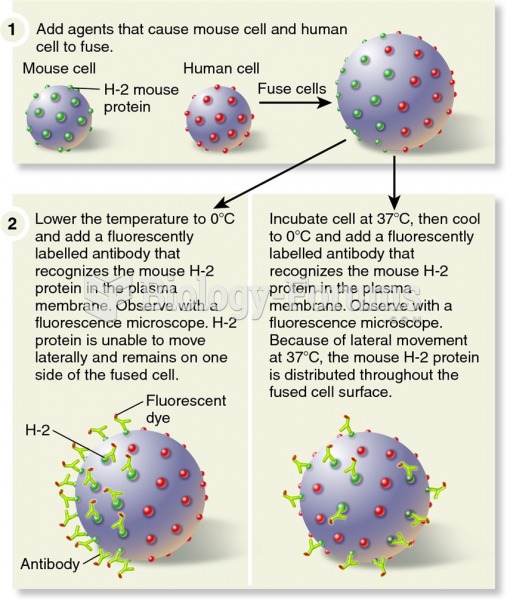 A method to measure the lateral movement of membrane proteins.
 Demonstrate the Application of Triangular, Figure-Eight, and Tubular Bandages
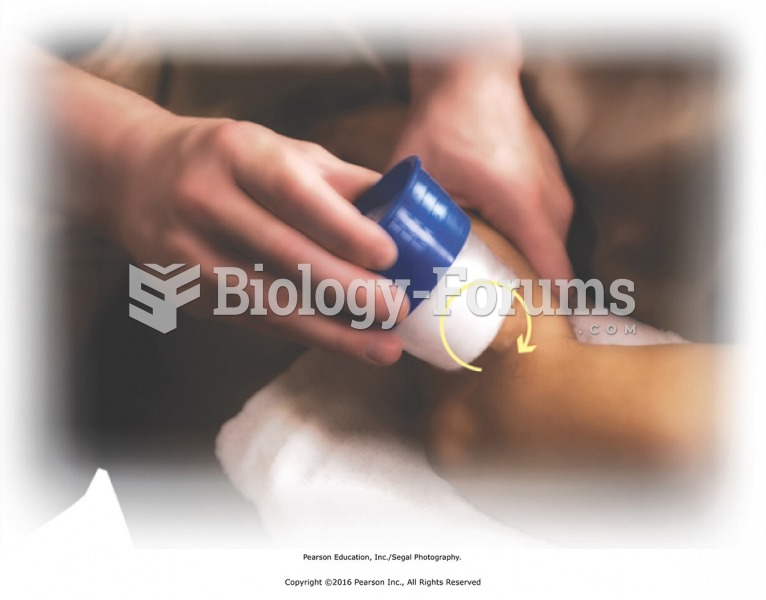 Circular movement of ice over lateral area just distal to the elbow. Use medium pressure to apply ...
 Figure and Ground
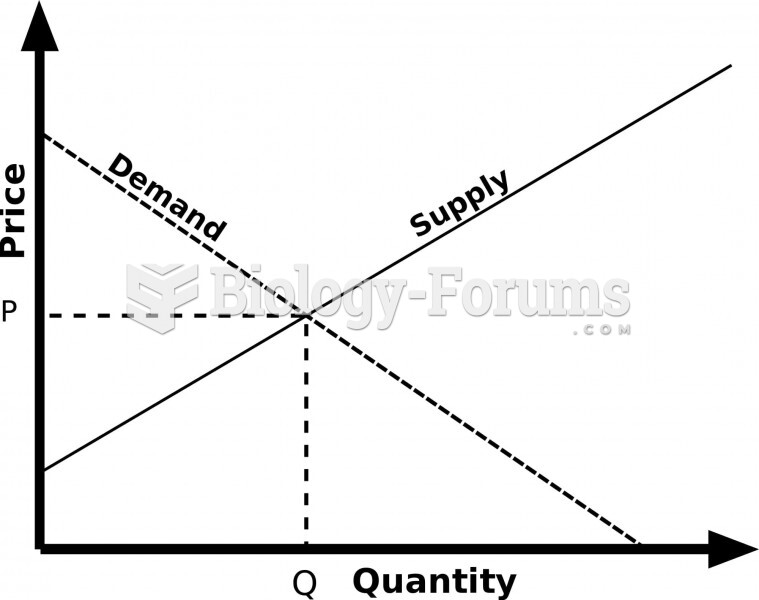 The original Supply and Demand graph
 Movement of fluids in the body is accomplished by A. osmosis, B. diffusion, or C. active transport