This topic contains a solution. Click here to go to the answer
|
|
|

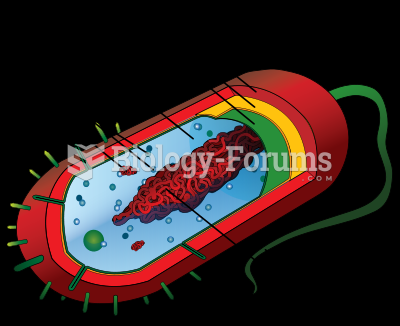 Diagram of a typical prokaryotic cell
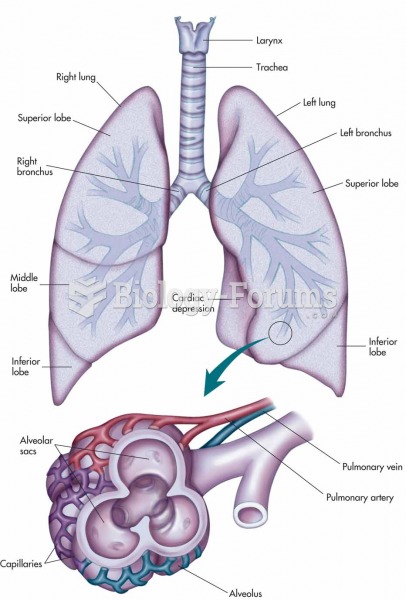 Larynx, trachea, bronchi, and lungs with an expanded view showing the structures of an alveolus and
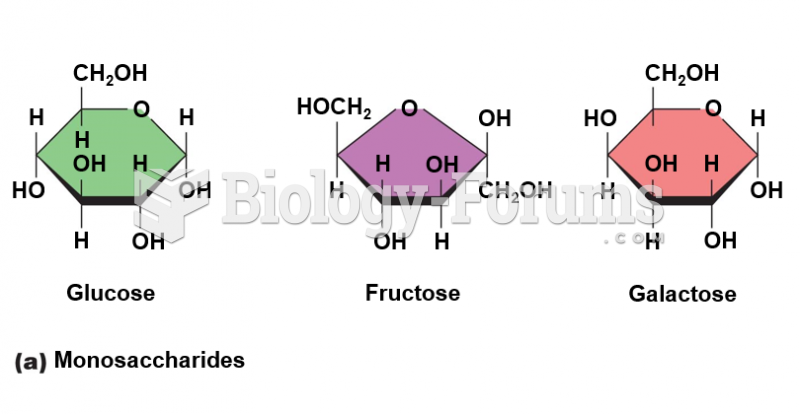 Monosaccharides Diagram
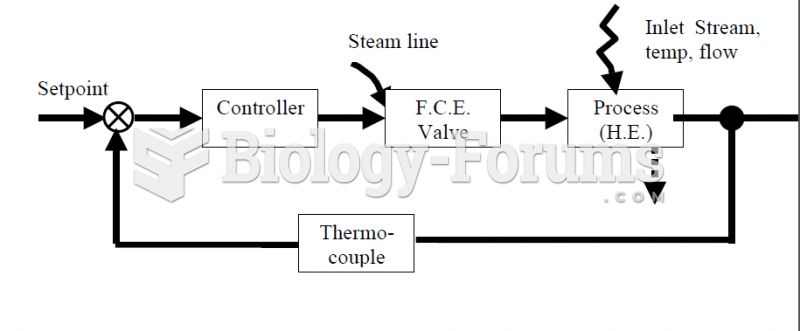 Heat Exchanger Block Diagram Feedback Control System
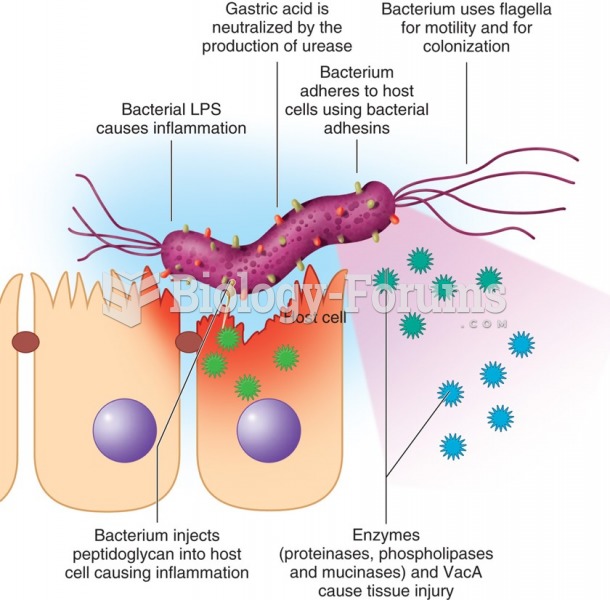 Schematic diagram of virulence factors of Helicobacter pylori.
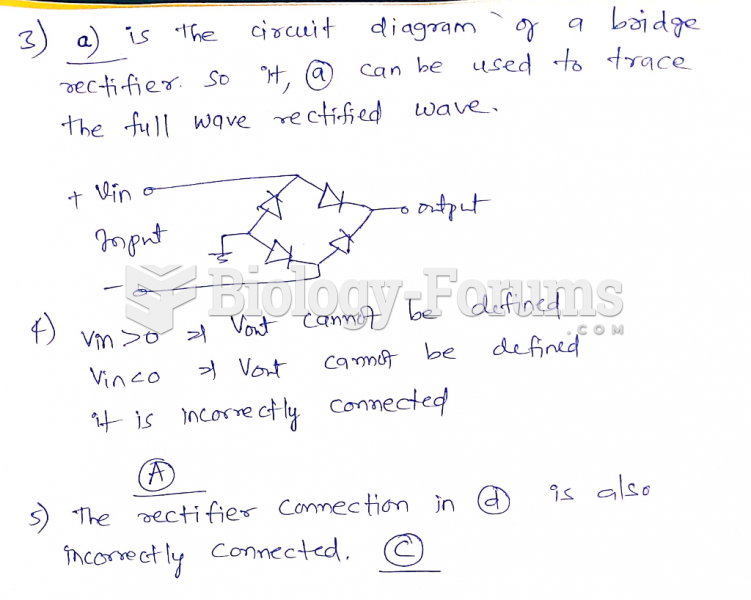 Refer to (d) in the figure above. This rectifier arrangement