This topic contains a solution. Click here to go to the answer
|
|
|

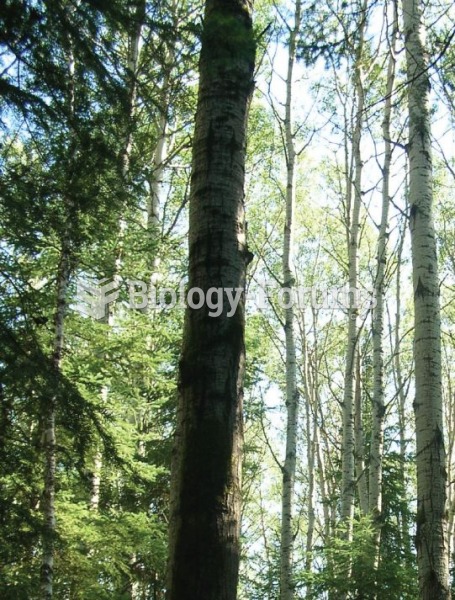 Changes in boreal forest composition along a chronosequence in Quebec. Dates refer to the year of th
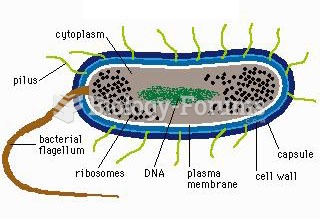 Bacteria Diagram
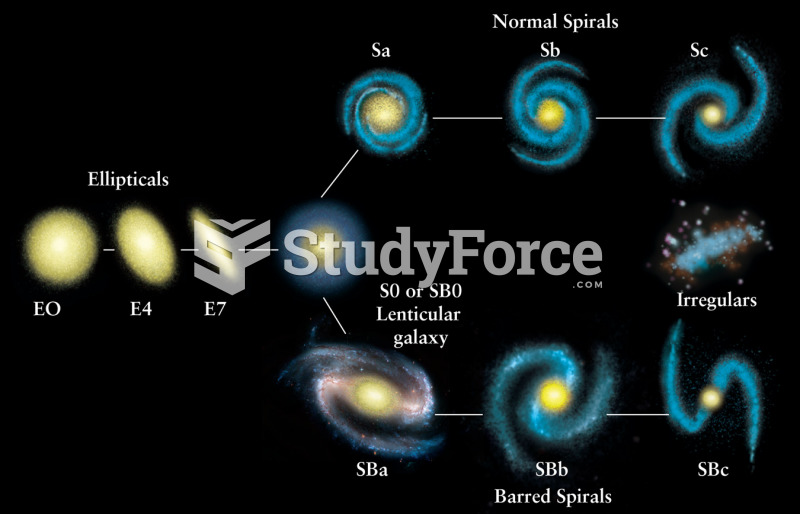 Hubble’s Tuning Fork Diagram
 diagram
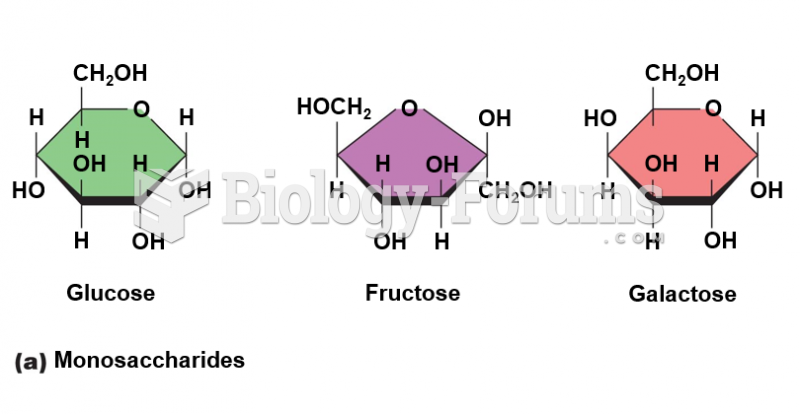 Monosaccharides Diagram
 Characteristics of the individual determine (a) whether they will be exposed to certain stressors ...