This topic contains a solution. Click here to go to the answer
|
|
|

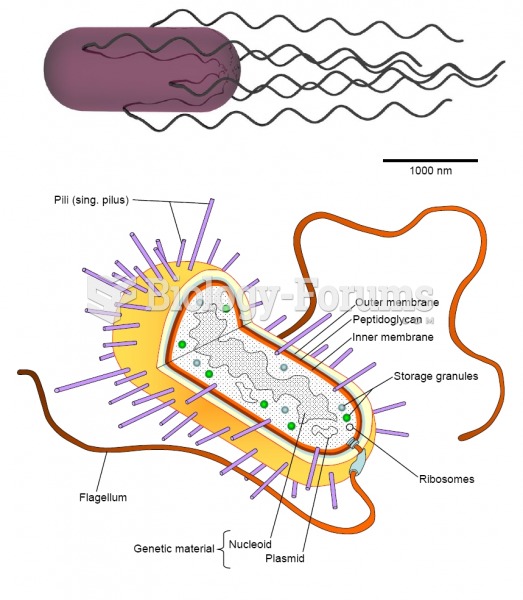 Bacteria Diagram
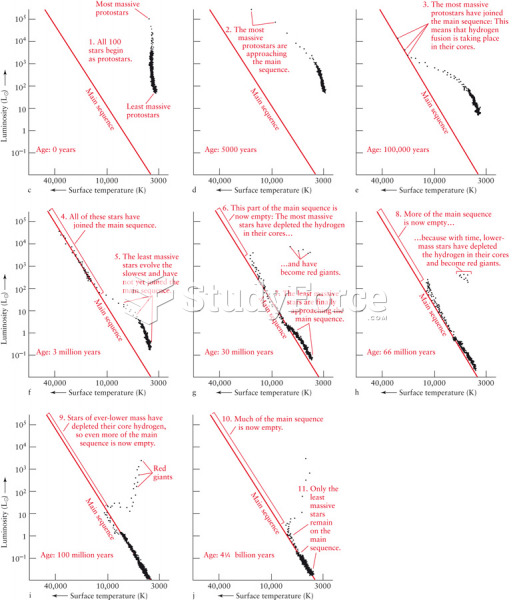 Structure of the H-R Diagram
 Demonstrate the Application of Triangular, Figure-Eight, and Tubular Bandages
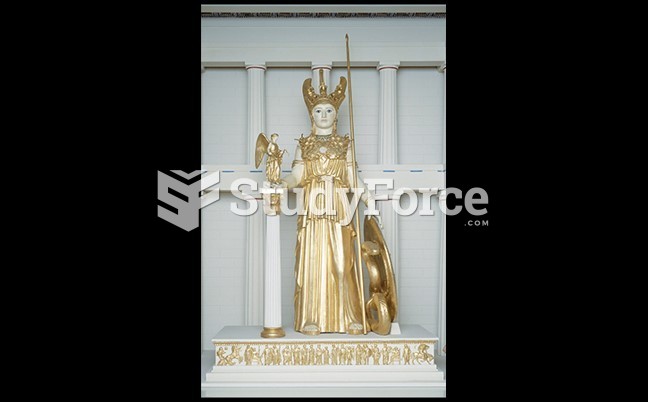 Re-creation of Pheidias’s Huge Gold and Ivory Figure of Athena
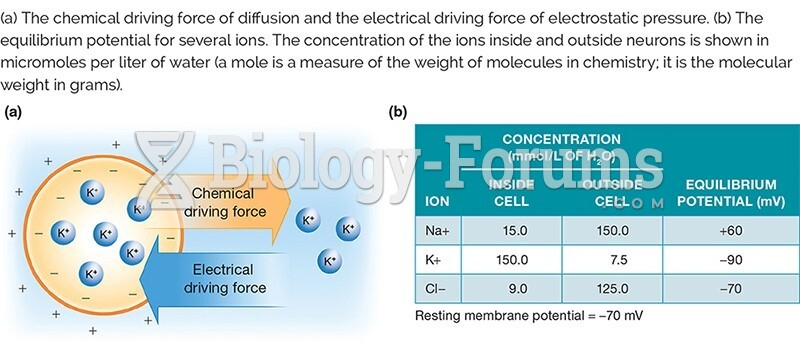 Figure 2.15.jpg
 Lod Score Values for the Families in Figure 5.15