This topic contains a solution. Click here to go to the answer
|
|
|

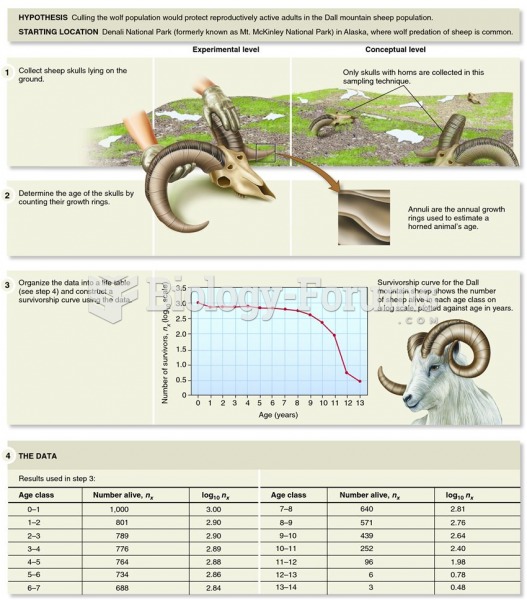 Examining the survivorship curve of a Dall mountain sheep population reveals information on the caus
 A biological profile from the bony remains of an individual may be preferable to a DNA profile for a
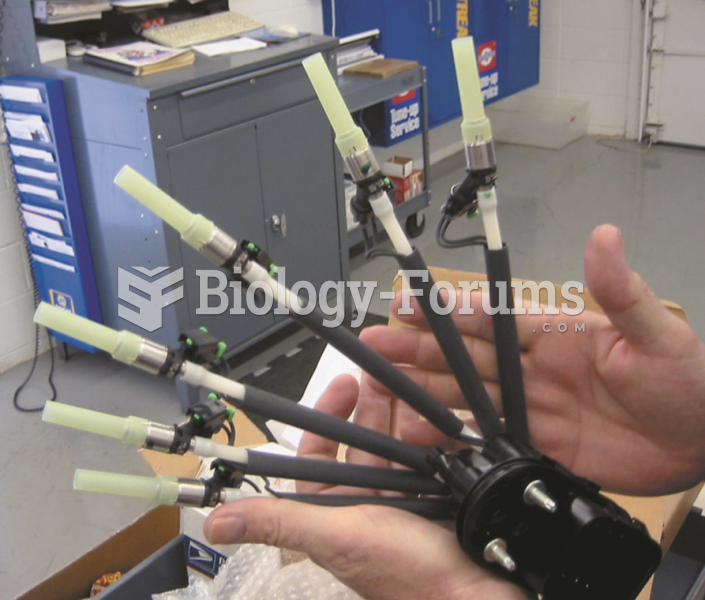 A factory replacement unit for a CSFI unit that has individual injectors at the ends that go into ...
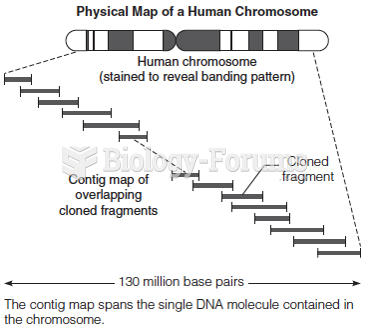 Sequencing a large chromosome by individual sequence determination of cloned fragments in sequences
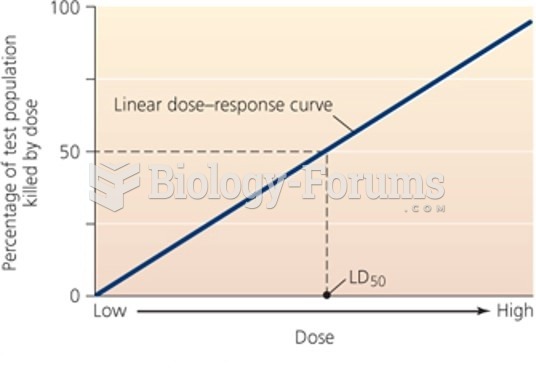 Linear dose-response curve
 Here, in alphabetical order, are 20 foods and 4 cultures.