|
|
|

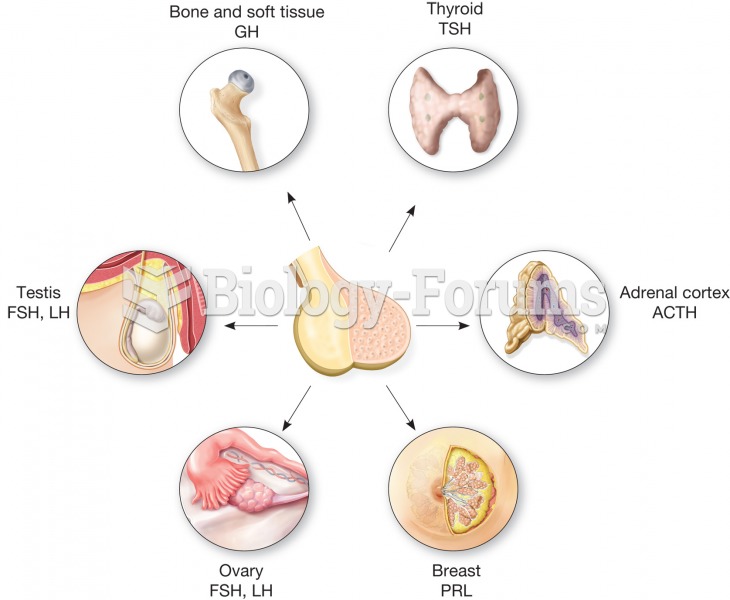 The anterior pituitary is sometimes called the master gland because it secretes many hormones that r
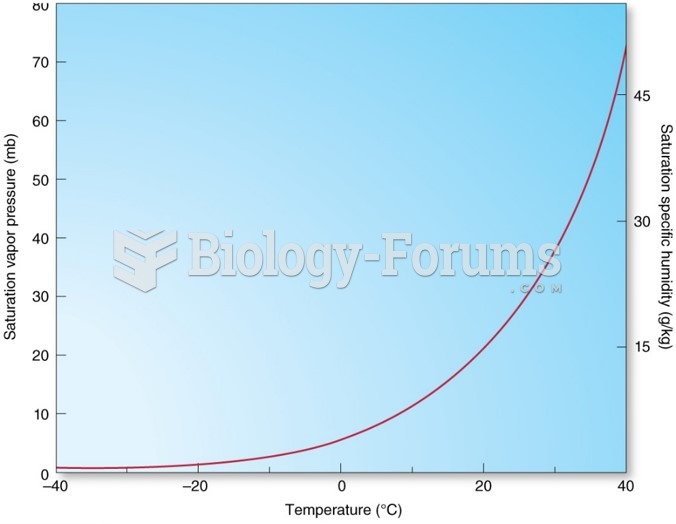 Nonlinear increase in saturation vapor pressure with increase in temperature.
 Mobilize knuckles with figure-8s. Turn the hand so palm faces the table. Grasp the proximal phalange ...
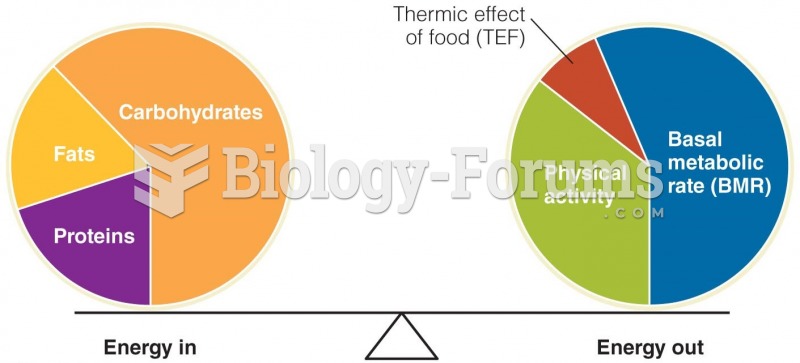 Energy Balance Is Achieved When Energy (Calories) In Equals Energy (Calories) Out
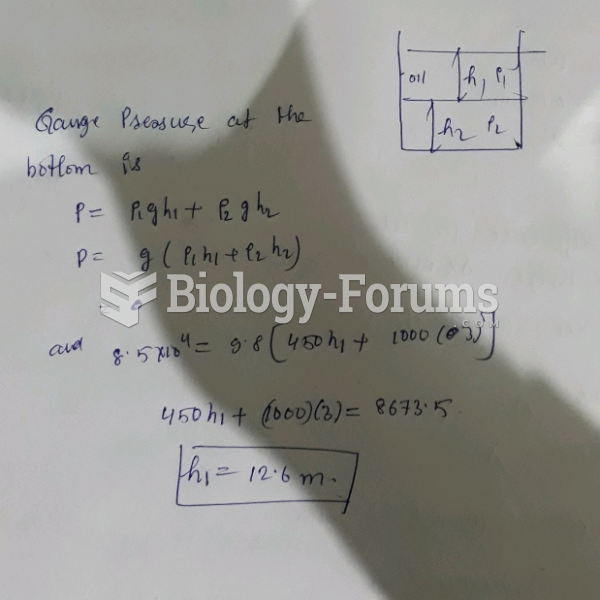 As shown in the figure, a large open tank contains a layer of oil ( density 450 kg/m3) floating ...
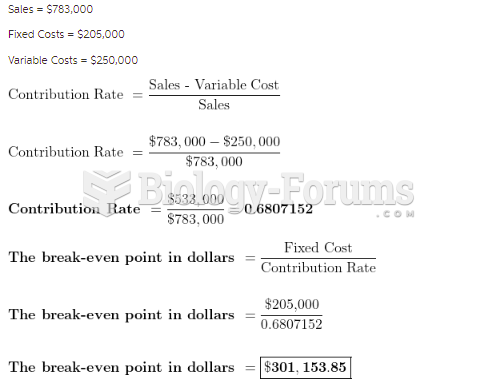 A company that makes environmental measuring devices has calculated their revenue and costs as ...