This topic contains a solution. Click here to go to the answer
|
|
|

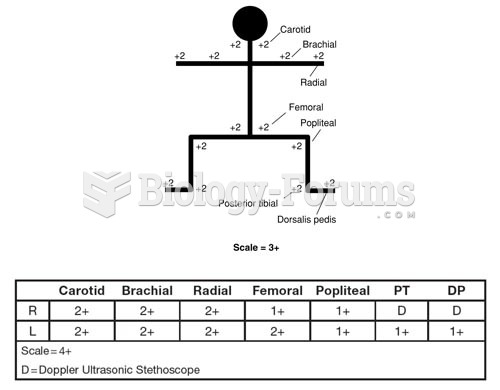 Methods to Document Peripheral Pulses A. Stick Figure Peripheral Pulse Documentation B. Tabular Peri
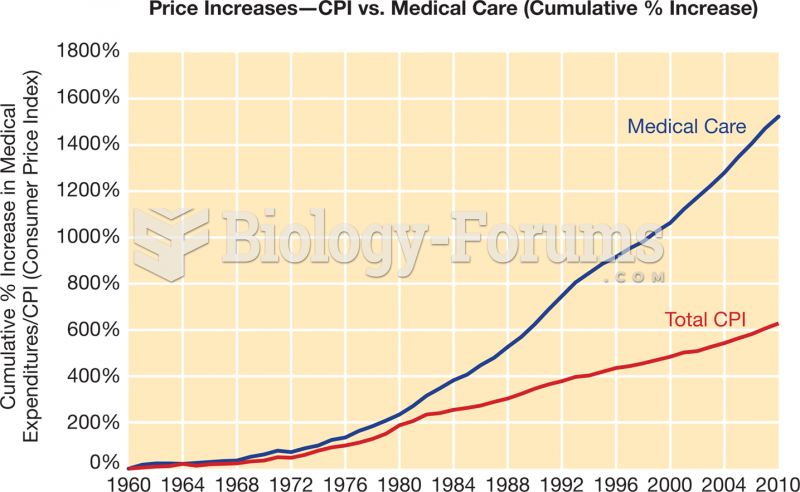 The Increasing Cost of Health Care, 1960–2010
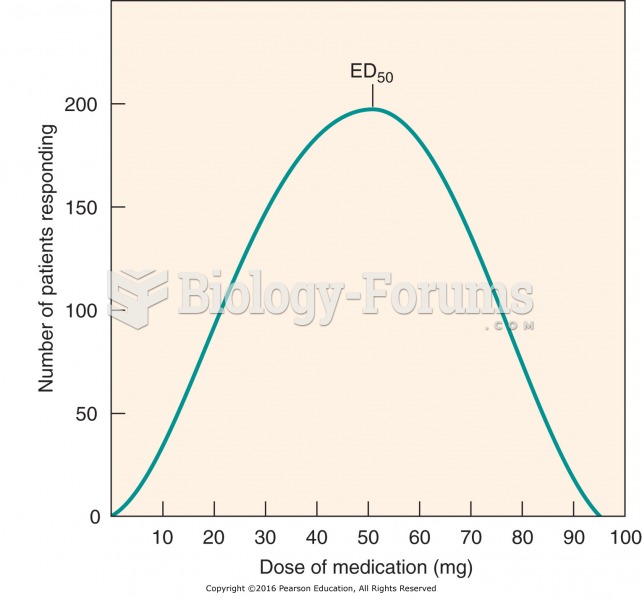 Frequency distribution curve: interpatient variability in drug response.
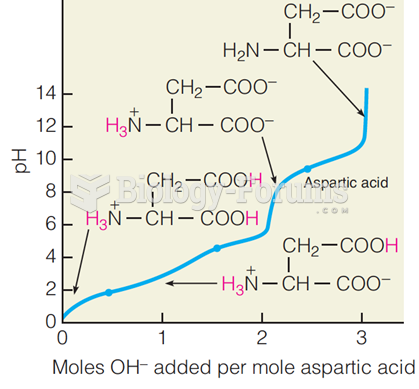 Titration curve for aspartic acid
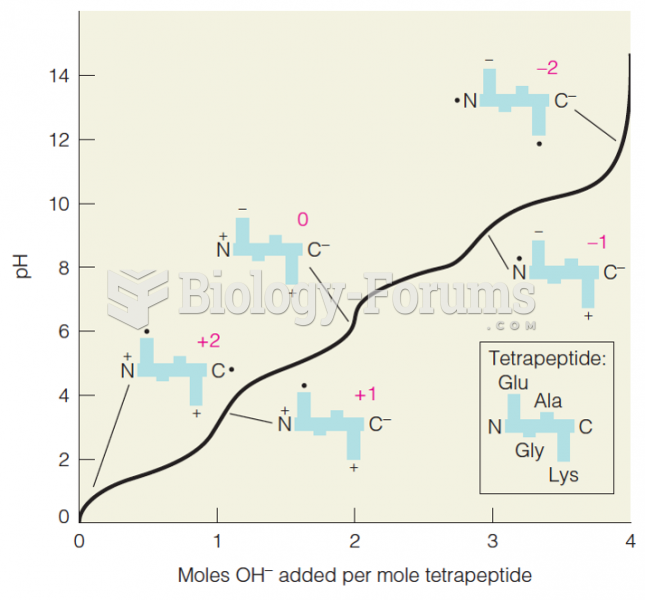 Titration curve for the tetrapeptide Glu-Gly-Ala-Lys
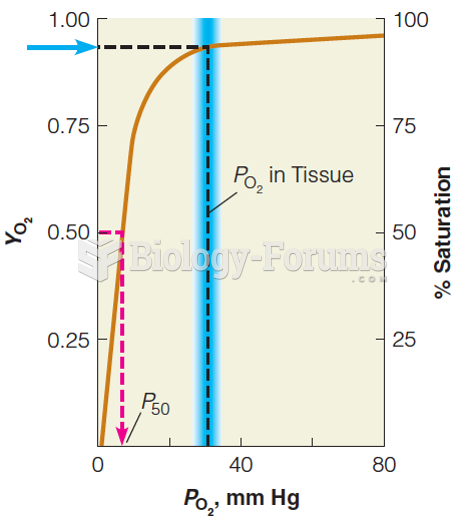 Oxygen-binding curve for myoglobin