This topic contains a solution. Click here to go to the answer
|
|
|

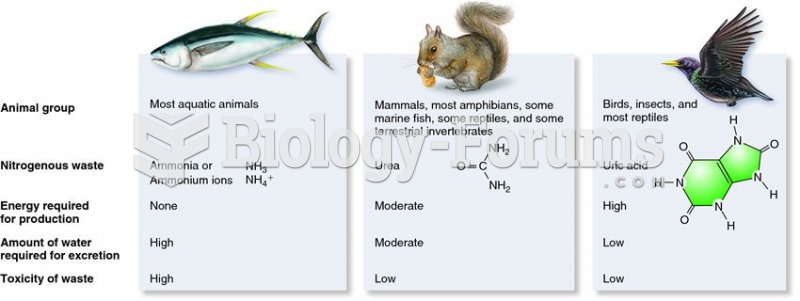 Nitrogenous wastes produced by different animal groups.
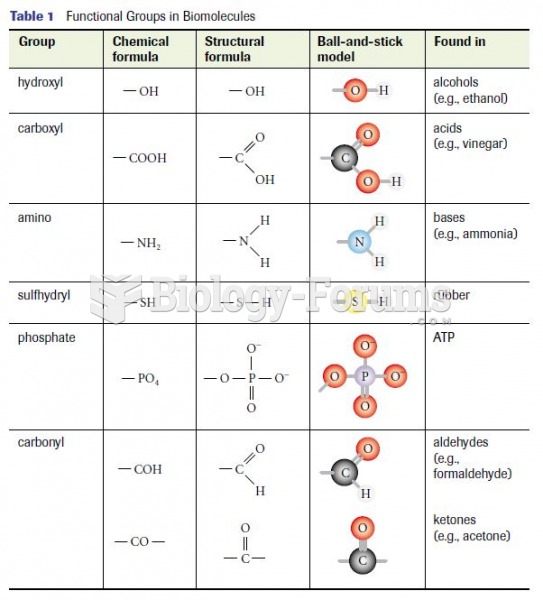 Functional groups
 Alan Price - Poor People
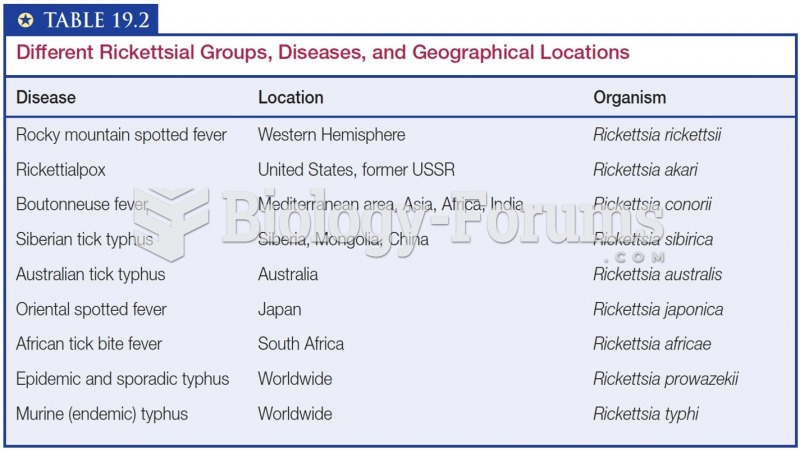 Different Rickettsial Groups, Diseases, and Geographical Locations
 College Physics
 Functional Groups of Carbon