This topic contains a solution. Click here to go to the answer
|
|
|

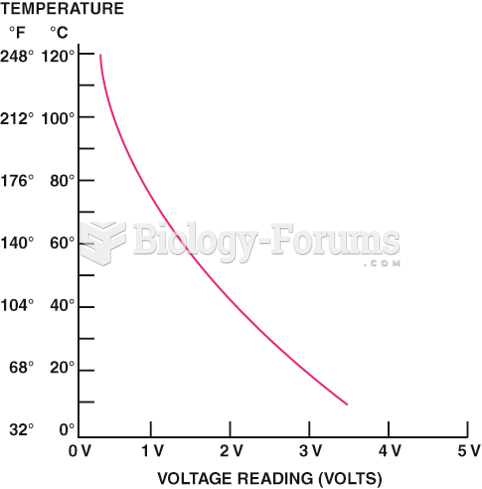 A typical ECT sensor temperature versus voltage curve.
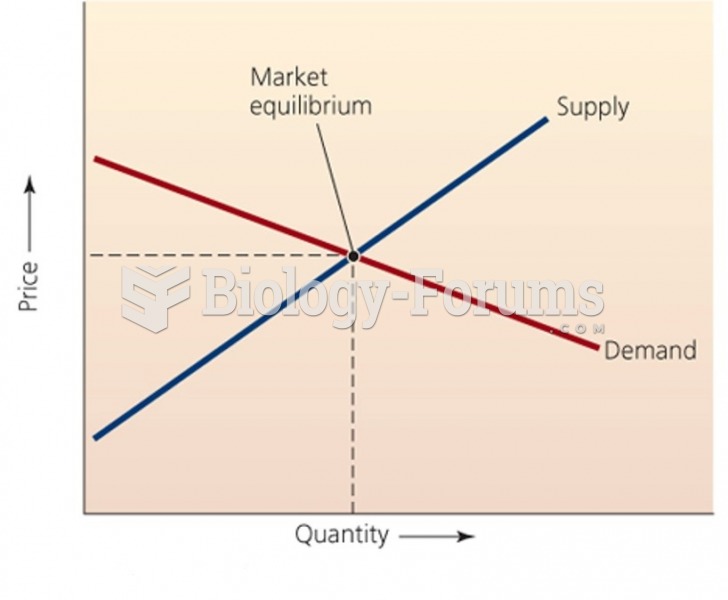 Classic Supply - Demand Curve
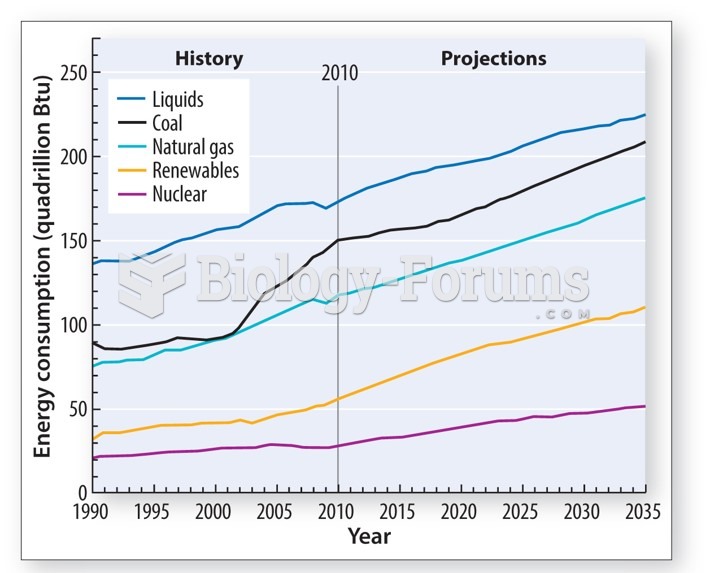 The growth in demand for energy use is met by burning fossil fuels
 1) (a) What is Coulomb?s Law? (b) Find the net electrostatic force on the charge labeled ?P? in ...
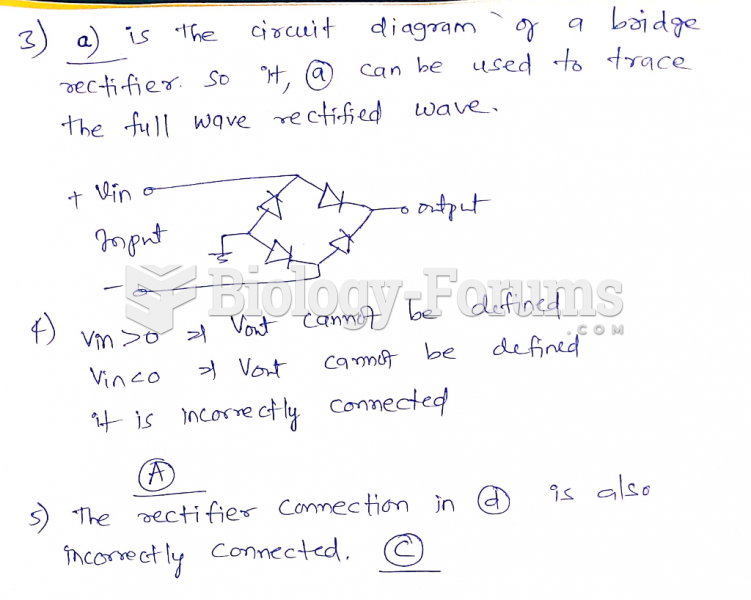 Refer to (d) in the figure above. This rectifier arrangement
 The circadian rhythm is a wave-like curve