This topic contains a solution. Click here to go to the answer
|
|
|

 A, A nurse is adding a medication to an IV line as a piggyback
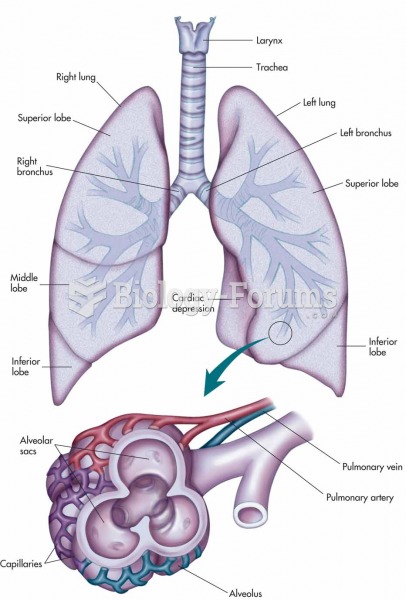 Larynx, trachea, bronchi, and lungs with an expanded view showing the structures of an alveolus and
 Time Line of Human History From Upper Paleolithic Period to the Present
 In-line blending is the most accurate method for blending ethanol with gasoline because computers ...
 Chart showing average yearly dose of radiation from natural and human-made sources
 question in cost accounting