In the figure above, diminishing marginal utility is shown by
A) total utility curve A.
B) total utility curve B.
C) total utility curve C.
D) all three curves.
Question 2
A monopoly is best defined as a firm that
A) produces a good or service for which no close substitute exists and which is protected by a barrier that prevents other firms from selling that good or service.
B) purchases its resources from only one supplier because of a barrier preventing it from buying from other suppliers.
C) produces a good or service for which no close substitute exists and that sells all its output to one buyer because there is barrier preventing other buyers from purchasing the good or service.
D) cannot control the price it sets for its good or service because there is barrier that prevents the firm from changing the price.

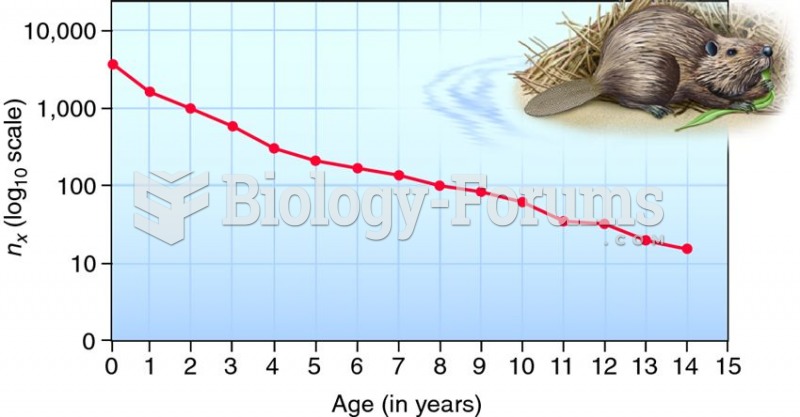 Survivorship curve for the North American beaver.
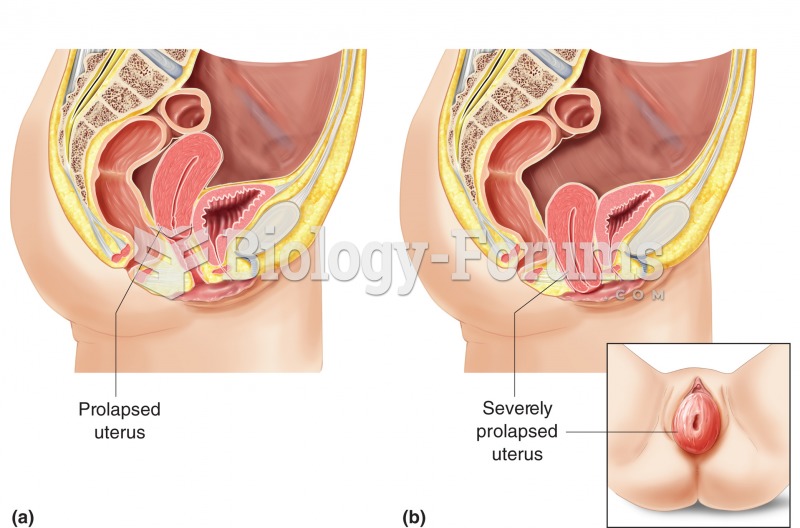 Prolapsed uterus. (a) A prolapse is the abnormal drop of the uterus into the vagina, representing th
 Nebulizer. The nebulizer converts a liquid medication to a mist that is easily inhaled. A face mask,
 The Geometry of a Total Solar Eclipse
 Re-creation of Pheidias’s Huge Gold and Ivory Figure of Athena
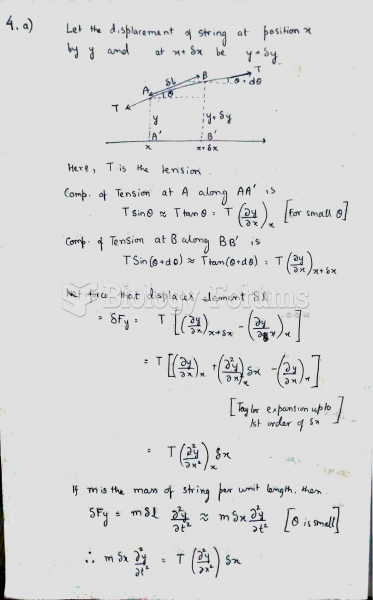 A wave whose wavelength is 0.500 m is traveling down a 500-m long wire whose total mass is 25 ...