Did you know?
Tobacco depletes the body of vitamins A, C, and E, which can result in any of the following: dry hair, dry skin, dry eyes, poor growth, night blindness, abscesses, insomnia, fatigue, reproductive system problems, sinusitis, pneumonia, frequent respiratory problems, skin disorders, weight loss, rickets, osteomalacia, nervousness, muscle spasms, leg cramps, extremity numbness, bone malformations, decayed teeth, difficulty in walking, irritability, restlessness, profuse sweating, increased uric acid (gout), joint damage, damaged red blood cells, destruction of nerves, infertility, miscarriage, and many types of cancer.
Did you know?
The average person is easily confused by the terms pharmaceutics and pharmacology, thinking they are one and the same. Whereas pharmaceutics is the science of preparing and dispensing drugs (otherwise known as the science of pharmacy), pharmacology is the study of medications.

 Norway lobsters on sale at a Spanish market
 figure 18-1 pituitary hormones
 Ugonachomma display figure, Igbo, Nigeria.
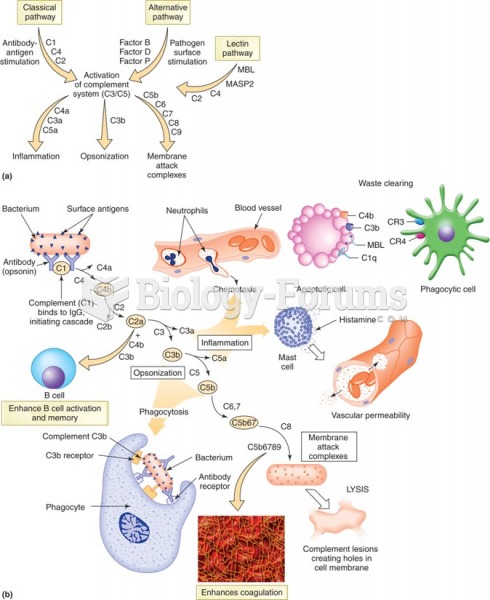 Three pathways of complement combined. (a) Figure shows a summary of how each pathway proceeds. (b) ...
 Stock Market Question
 Markets and Institutions Market Story Problem