This topic contains a solution. Click here to go to the answer
|
|
|

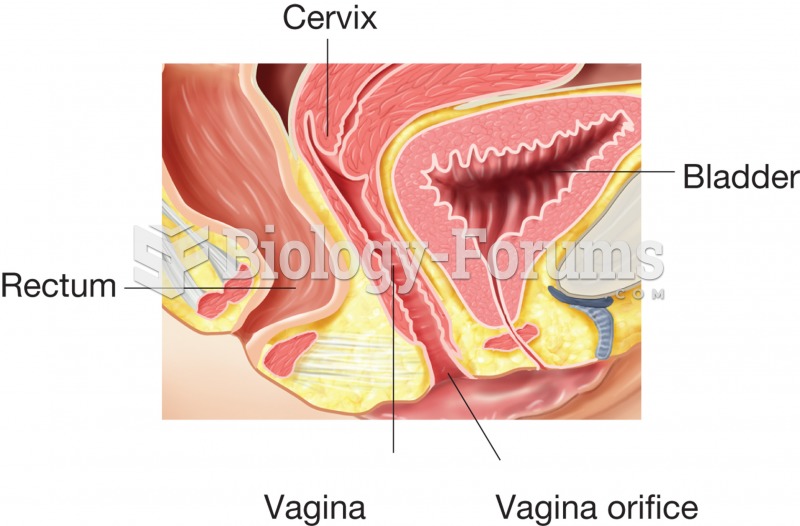 The vagina, sagittal section showing the location of the vagina and its relationship to the cervix,
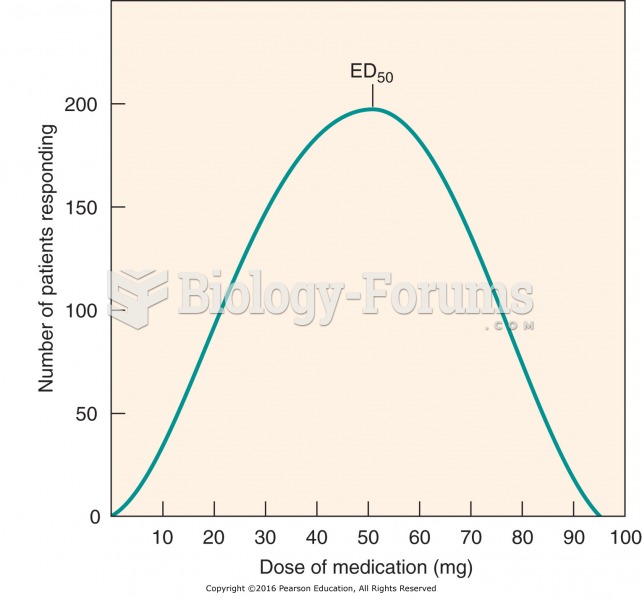 Frequency distribution curve: interpatient variability in drug response.
 A histologic slide showing the sponge-like architecture of a patient with Creutzfeldt-Jakob Disease.
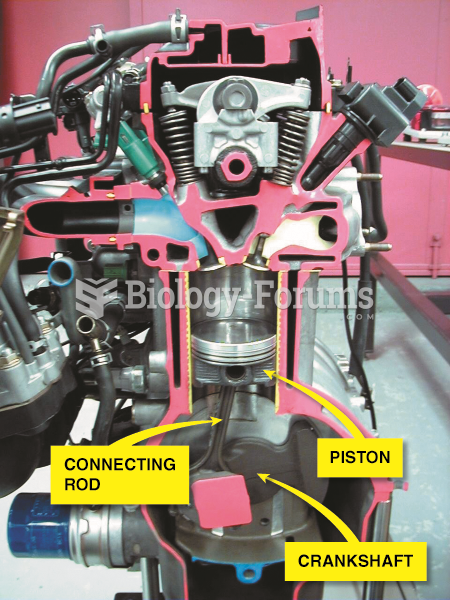 Cutaway of an engine showing the cylinder, piston, connecting rod, and crankshaft.
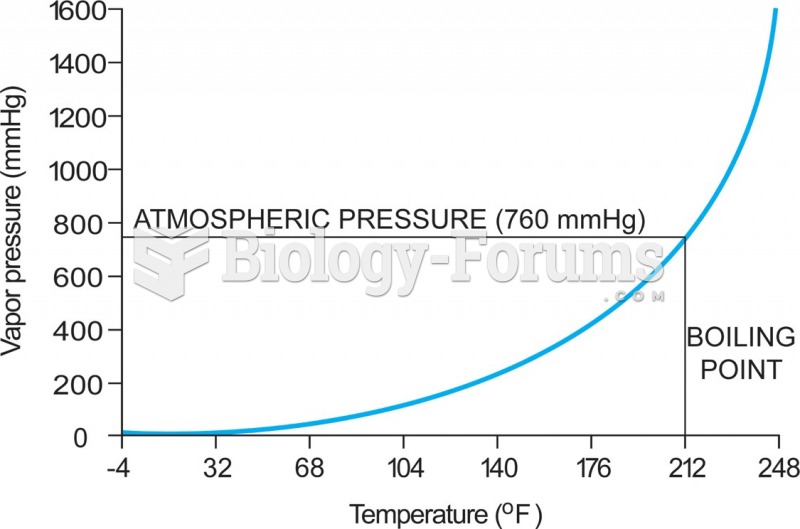 5-4 The relationship between vapor pressure and temperature—in this case for water. As the ...
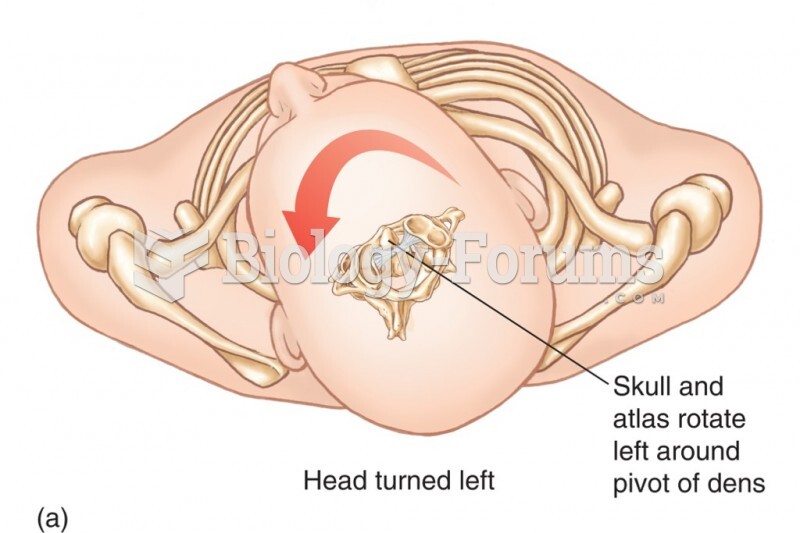 Relationship Between the Atlas and the Axis. The Dens of the Axis Provides a Pivotal Point Around Wh