This topic contains a solution. Click here to go to the answer
|
|
|

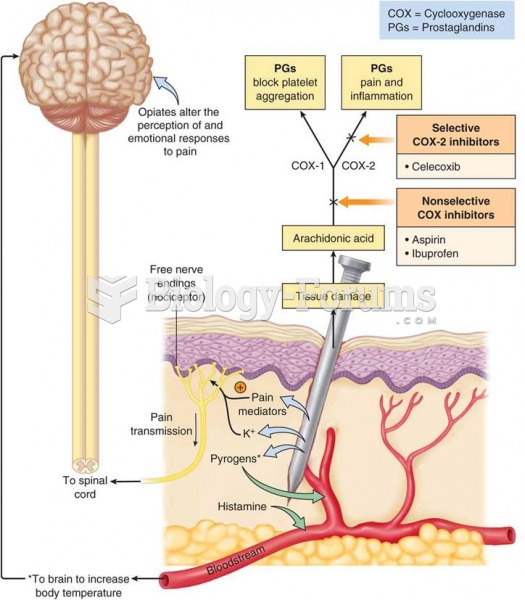 Mechanisms of pain at the nociceptor level
 The power and control wheel illustrates the strategies that one partner may use to intimidate, ...
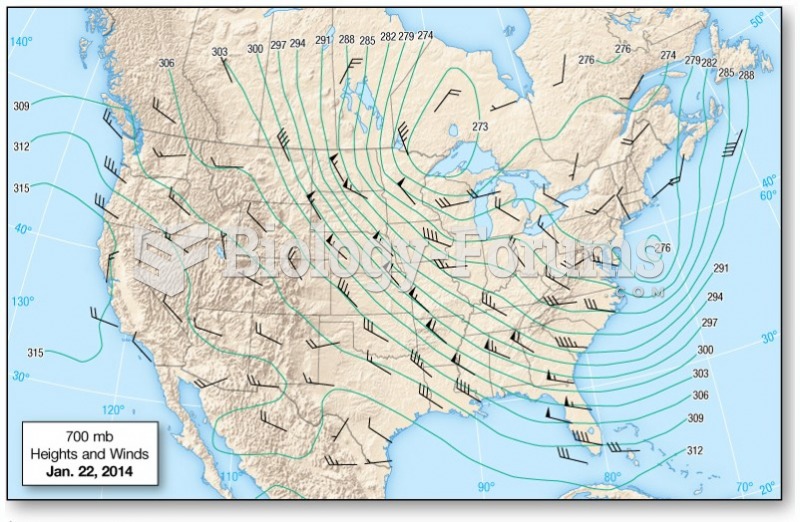 Upper-Level Maps
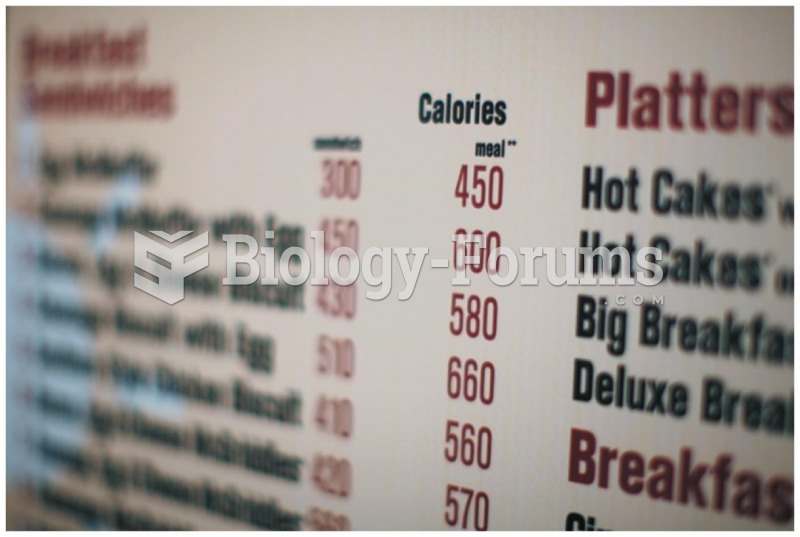 Will Posting Nutritional Content in Restaurants Have a Positive Impact on the Obesity Epidemic?
 Figure and Ground
 As shown in the figure, a large open tank contains a layer of oil ( density 450 kg/m3) floating ...