This topic contains a solution. Click here to go to the answer
|
|
|

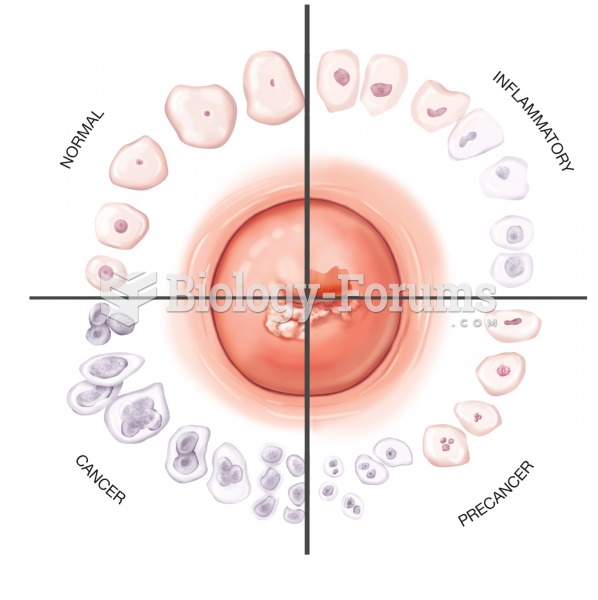 Pap smear. Cells of the cervix (shown in the center) change in appearance as they progress through
 The explosion of the Maine in Havana harbor, killing 260 men, caused much speculation in the newspap
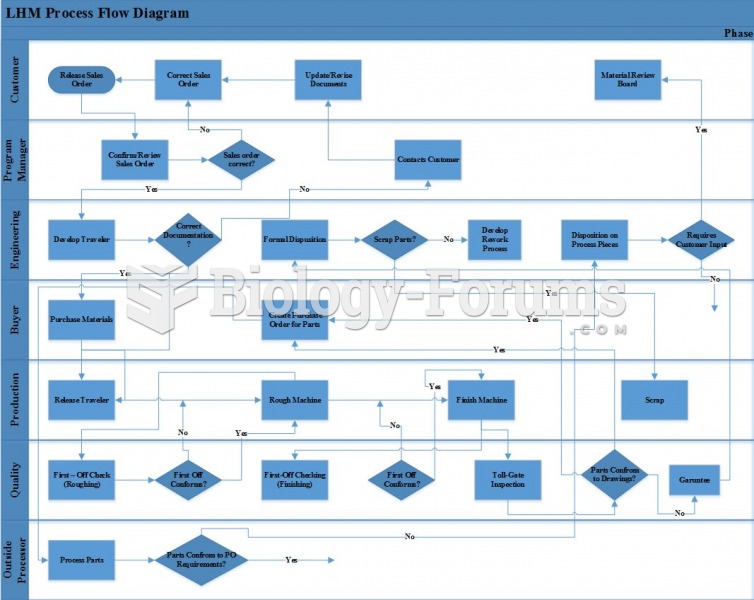 Lean 6 Sigma - LHM Process Flow Diagram
 Head with Remains of Painted Decoration
 Venn diagram representation of 17,067 medium and large clusters of protein
 plant diagram