The above table shows data on two variables. If these data were graphed, the slope of the line would be
A) 3/5.
B) 3.
C) 5/3.
D) impossible to determine from the information given.
Question 2
Members of a cartel who refrain from selling at prices below the prices established by the cartel will usually
A) continue indefinitely to receive a high net revenue.
B) discover other ways to attract additional customers.
C) have no incentive to improve the quality of their products.
D) not compete against one another.
E) want to attract additional firms into the industry to increase the size of the cartel.

 This diagram shows a cross-section of a solar-type star.
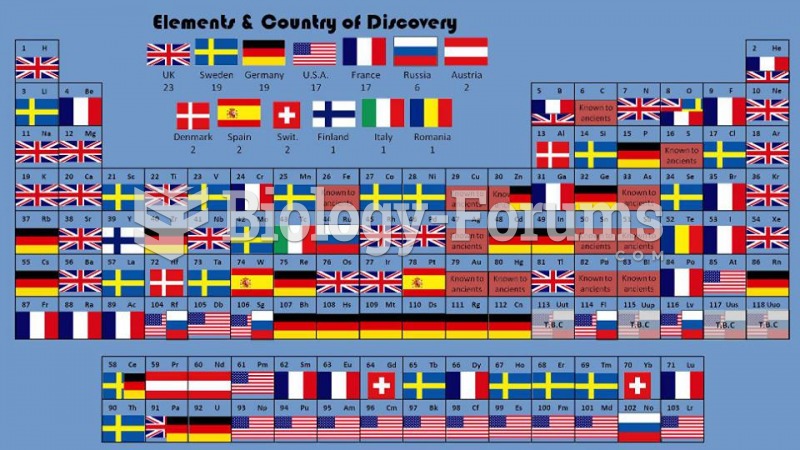 Periodic Table
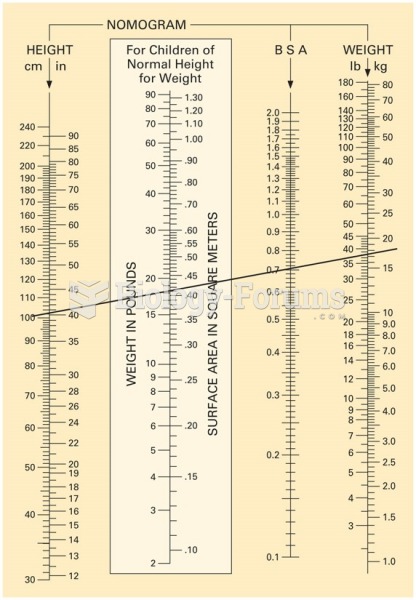 Nomogram chart. This example shows a line drawn from a child’s height of 100 cm to his weight, 35 ...
 Standing at the head of the table, apply oil or lotion to the entire back and shoulders with ...
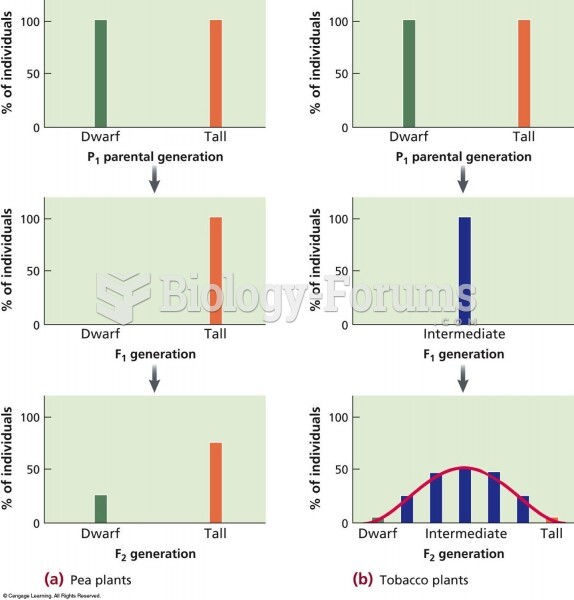 A comparison of a trait (height) that shows discontinuous and continuous phenotypes in different pla
 Chi-Square Analysis of Mendel’s Trihybrid-Cross Data