Refer to the figure above. The region BAH represents the ________.
A) consumer surplus after taxation
B) tax incidence on consumers
C) tax incidence on producers
D) deadweight loss due to taxation
Question 2
By itself, a supply shock, such as a hike in the price of oil, can
A) cause real GDP to permanently decrease year after year.
B) not result in persisting inflation.
C) be inflationary as long as there is no policy response.
D) result in persisting inflation if aggregate supply persistently increases.
E) result in a persisting wage-price spiral.

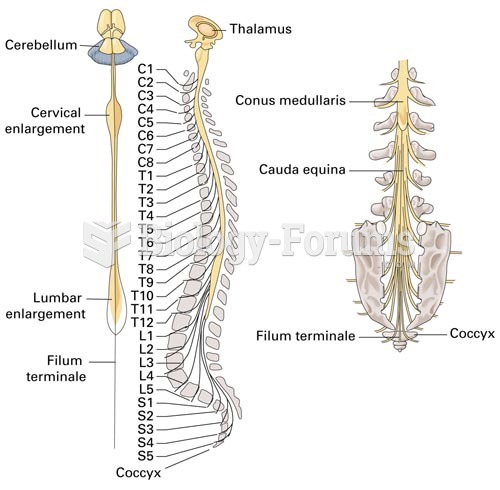 The Spinal Cord, The Spinal Cord and Spinal Nerves; Close-up of the Caudal Region of the Spinal Nerv
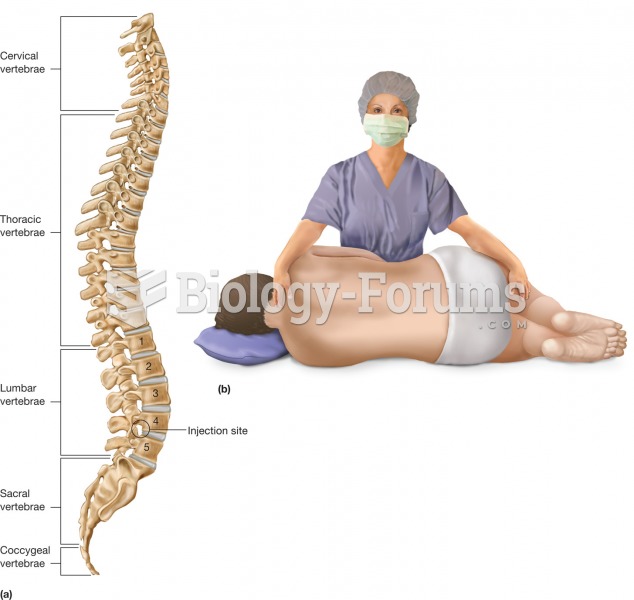 Lumbar puncture. Abbreviated LP, the lumbar puncture is a common procedure that withdraws cerebrospi
 A Gas- and Dust-Rich Region of Orion
 The Sleep/Waking Flip-Flop According to Saper et al. (2001), the major sleep-promoting region (the v
 Colossal Figure of Akhenaten
 Swimming Pool (Figure 3.1)