|
|
|

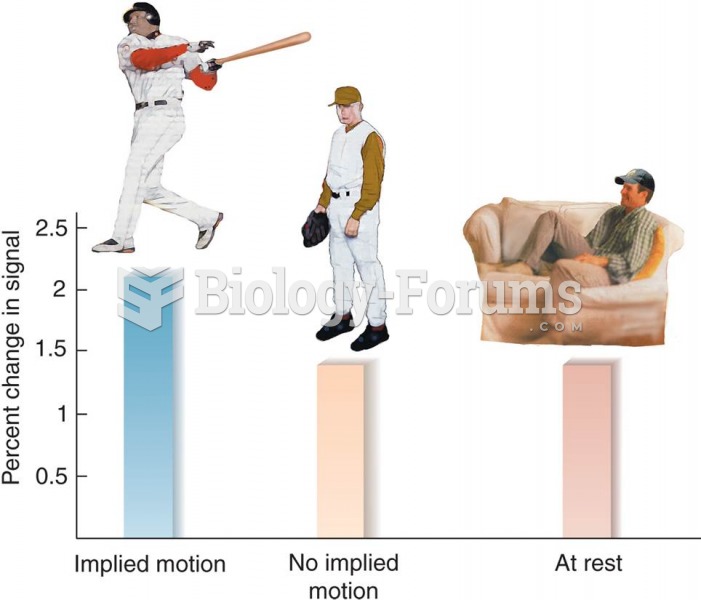 Evidence of Retrieval of Visual Memories of Movement
 How to find the equation of a line that is perpendicular to a line passing through a point
 Testing rapid alternating movement, palm down
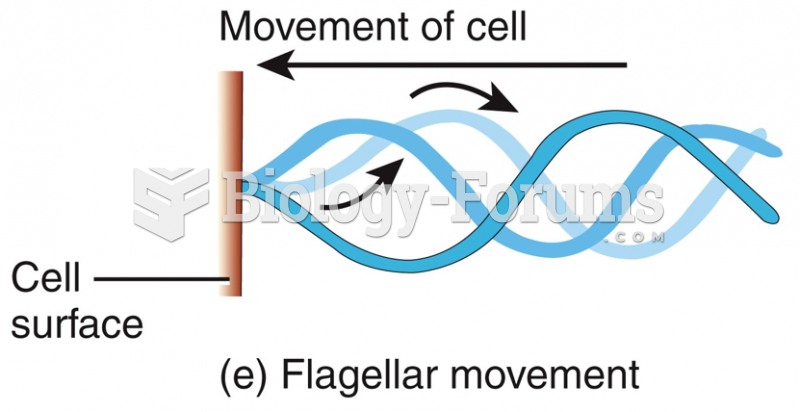 Flagellar movement
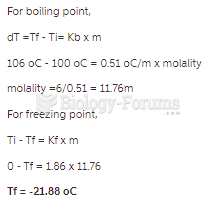 An aqueous solution has a normal boiling point of 103.0C. What is the freezing point of this ...
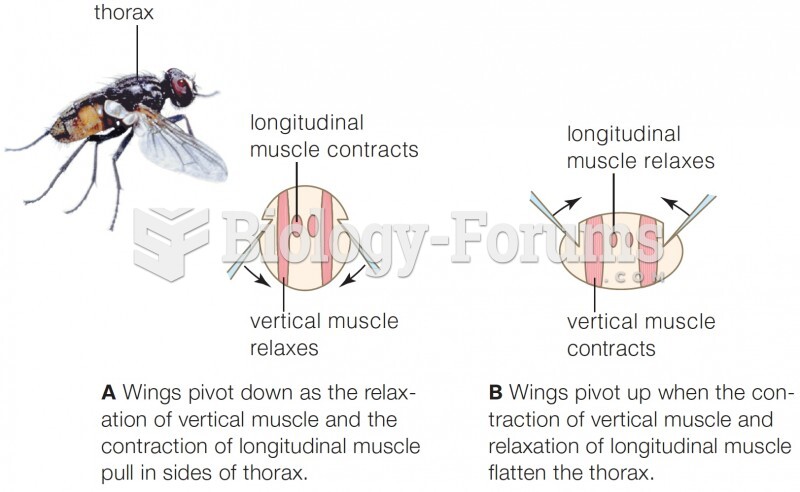 Fly wing movement