You have data for the amount of rainfall in 50 cities for the month of June. The type of graph to best display these data would be a
A) multi-variable time series graph.
B) trend-line diagram.
C) time-series graph.
D) scatter diagram.
E) cross-section graph.
Question 2
An increased federal budget deficit resulting from a recession can actually help stabilize an economy, because corporate profits tend to fall in a recession which, in turn, results in ________ corporate taxes and ________.
A) lower; increases in the price level B) lower; fewer spending cuts for businesses
C) higher; larger profits for businesses D) higher; more tax revenue for the government

 How to create a frequency table and histogram from raw data
 Demographic Data for Nigeria
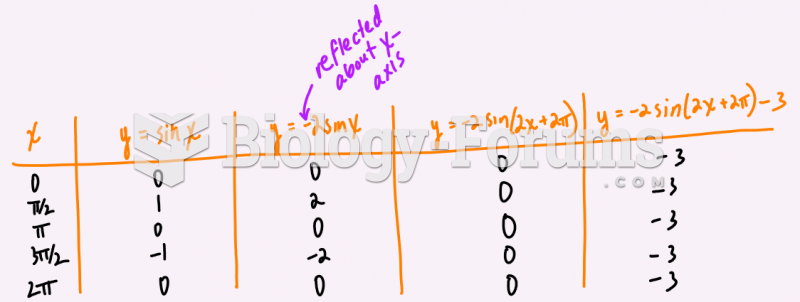 State the transformations on the function f(x)= 4sin(x-pi)-2 and then graph two cycles below.
 Bar-eye phenotypes in contrast to the wild-type eye in Drosophila
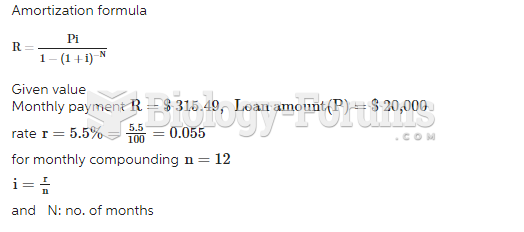 Jamal plans to retire in 17 years. He is saving $2000 every start of the month in a retirement ...
 Satellite data on primary productivity in the equatorial Pacific Ocean