This topic contains a solution. Click here to go to the answer
|
|
|

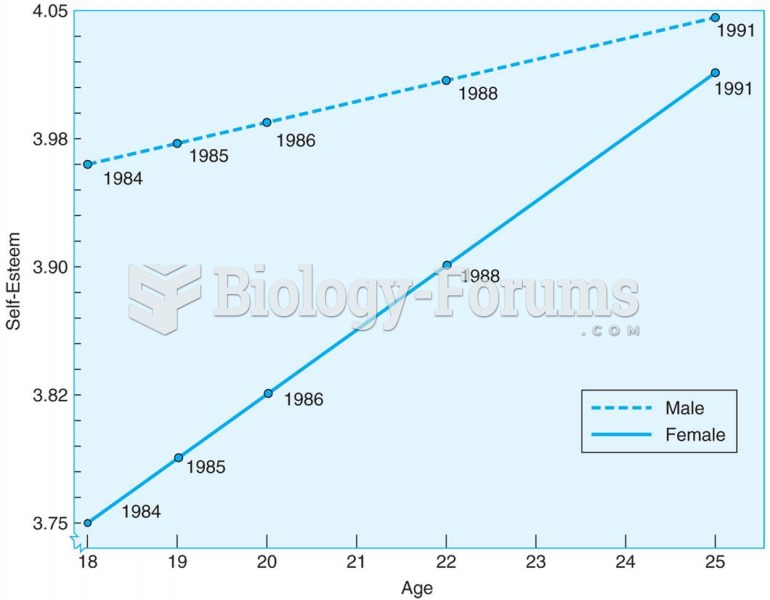 Young adults increase in self-esteem between the ages of 18 and 25, according to this longitudinal s
 Demonstrate the Application of Triangular, Figure-Eight, and Tubular Bandages
 Desertification and Climate Change
 Move joints in hands. Apply scissoring to metacarpals and figure-8s to fingers.
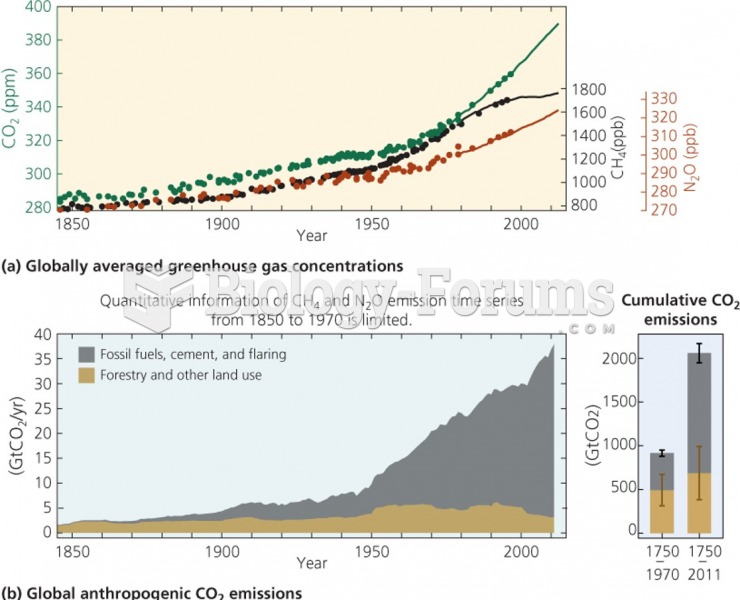 Global climate change and CO2 concentration
 Ancient Climate Change