This topic contains a solution. Click here to go to the answer
|
|
|

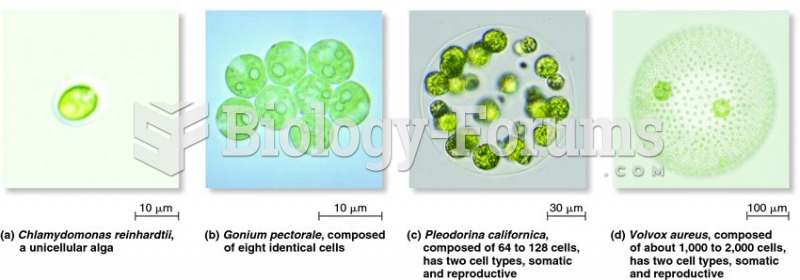 Variation in the level of multicellularity among volvocine algae
 The world attempted to deal with Somalia as if it were a real country but painfully learned that Som
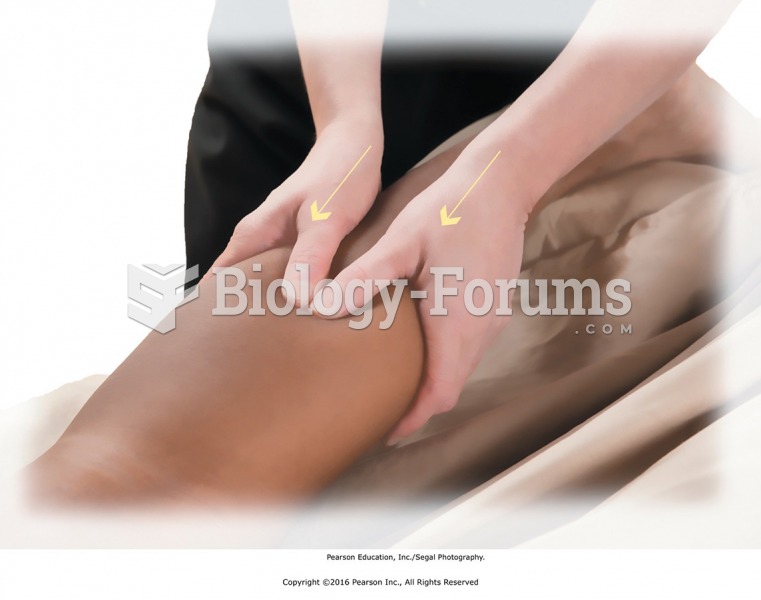 Basic sliding effleurage using the palms of the hands provides full contact with the leg.
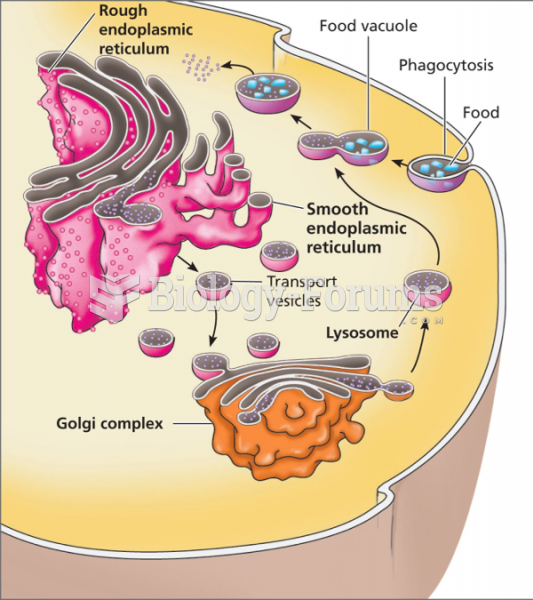 The relationship between the Golgi complex and lysosomes
 Let f be a real function with domain R. Suppose that for each ǫ > 0, there is a continuous ...
 Refer to Scenario 3.1. If the price of potato chips is $0.50 and the price of Cola is $4.00, ...