This topic contains a solution. Click here to go to the answer
|
|
|

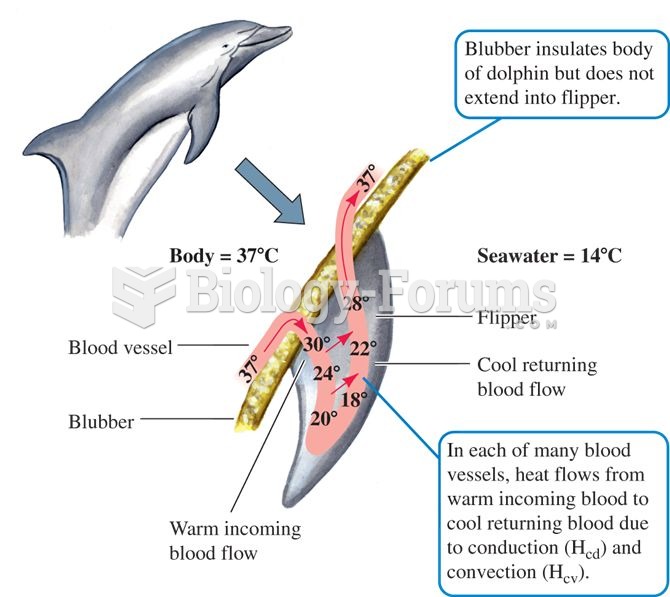 Countercurrent heat exchange in dolphin flippers promotes conservation of body heat.
 Booker T. Washington in his office at Tuskegee Institute, 1900. Washington chose a policy of accommo
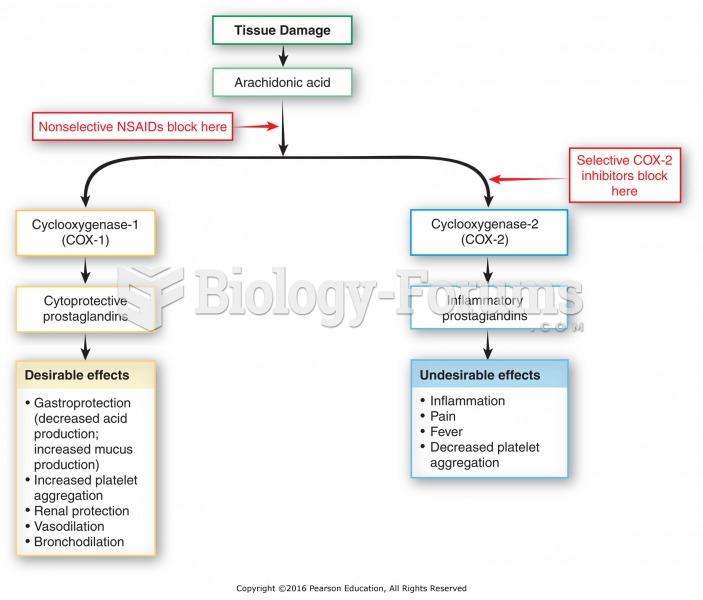 Inhibition of cyclooxygenase 1 and 2. Nonselective NSAIDs block the cytoprotective effects as well ...
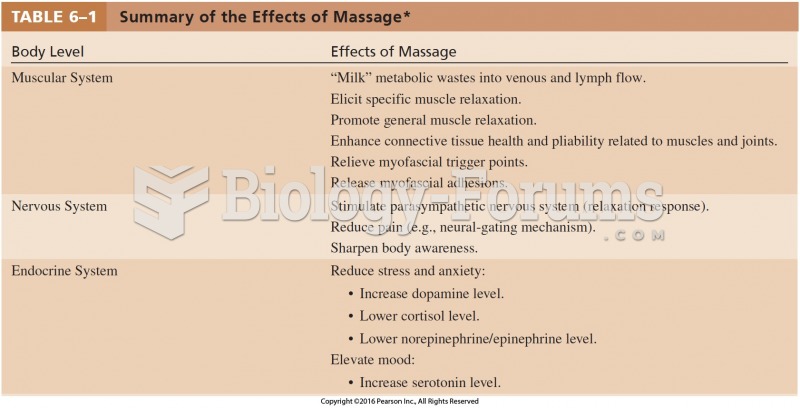 Summary of the Effects of Massage Cont.
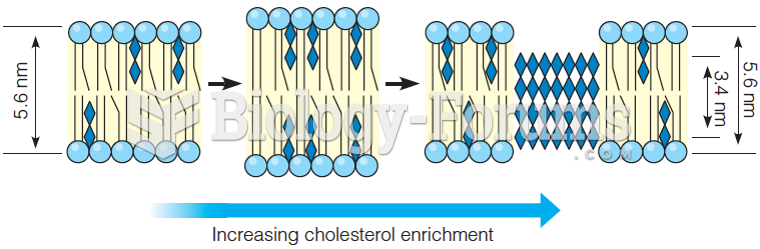 A schematic model of the effects of cholesterol on synthetic membrane structure
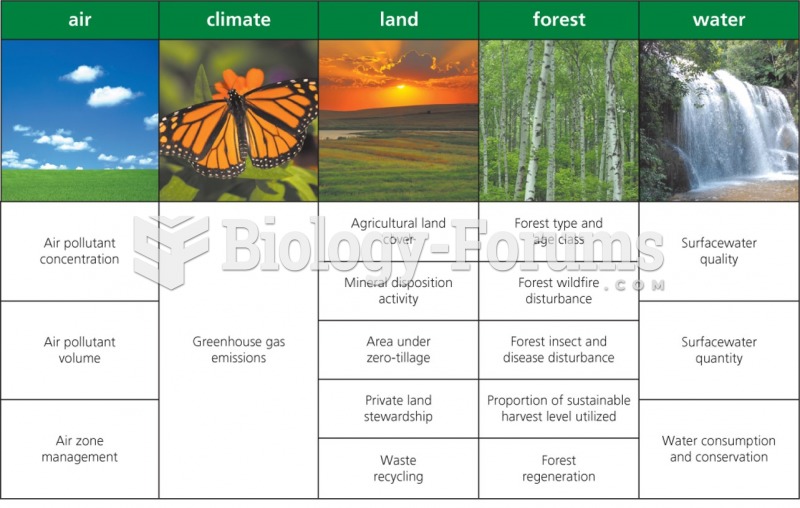 Scientific monitoring with environmental policy (SOER)