|
|
|

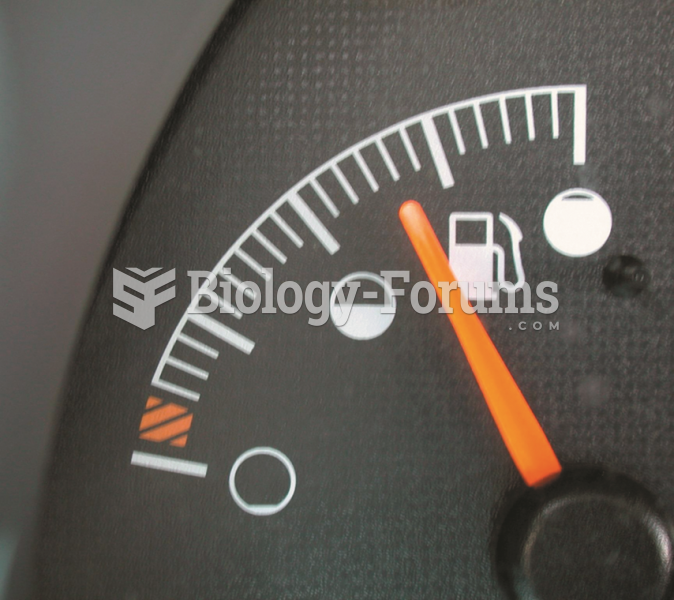 The fuel level must be above 15% and below 85% before the EVAP monitor will run on most vehicles.
 How to use the discriminant to determine the value of k in a quadratic with no real roots
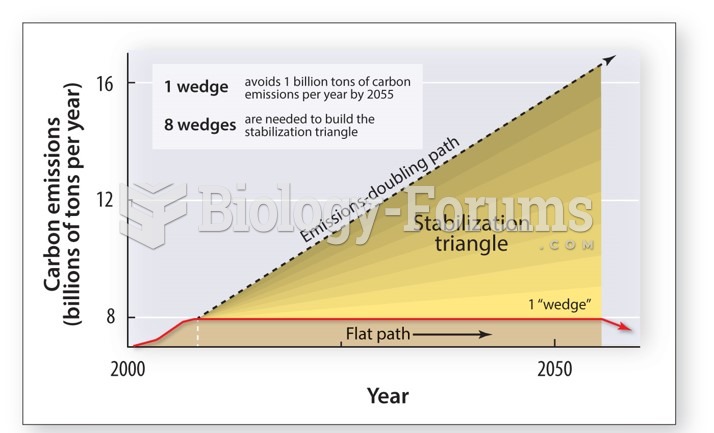 The gap between the projected level of greenhouse gas emissions
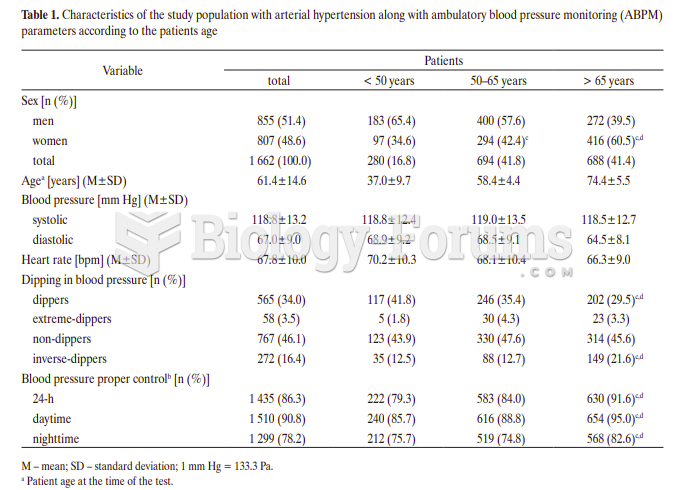 What level of barometric pressure effects body?
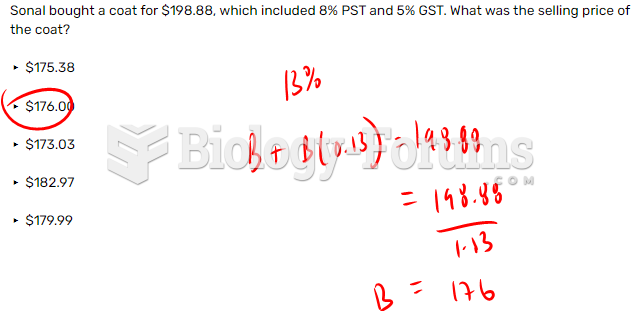 Sonal bought a coat for $198.88, which included 8% PST and 5% GST. What was the selling price ...
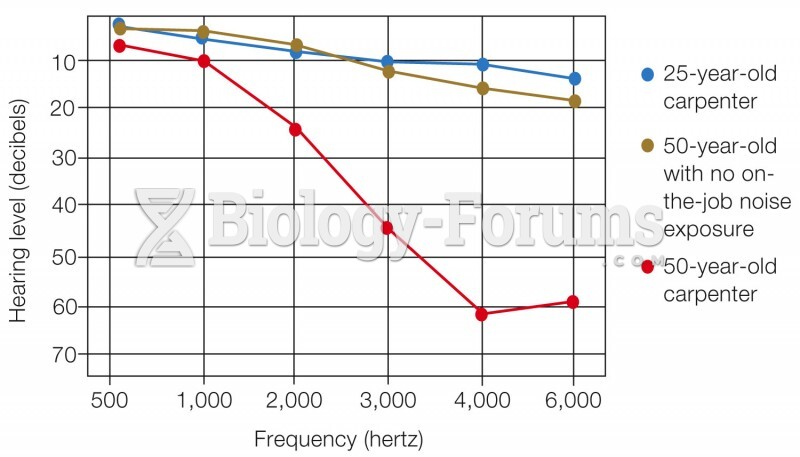 Hearing level comparison amongst workers