|
|
|

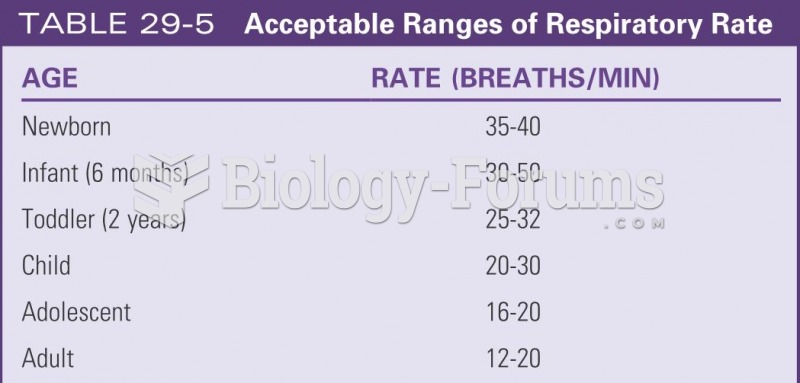 Acceptable ranges of respiratory rate
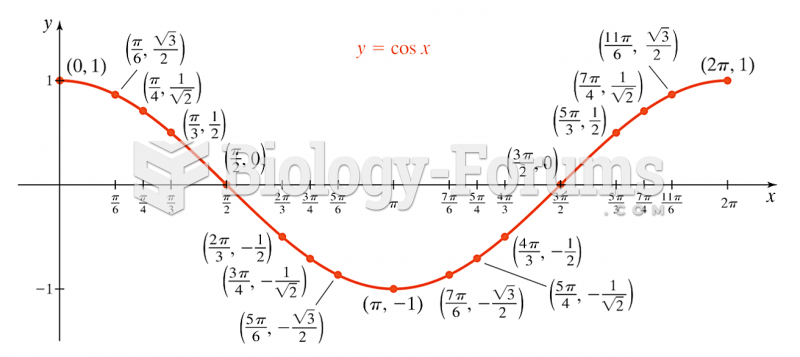 Graph of cos(x)
 graph
graph
 Finding the graph of a Parabola using certain values
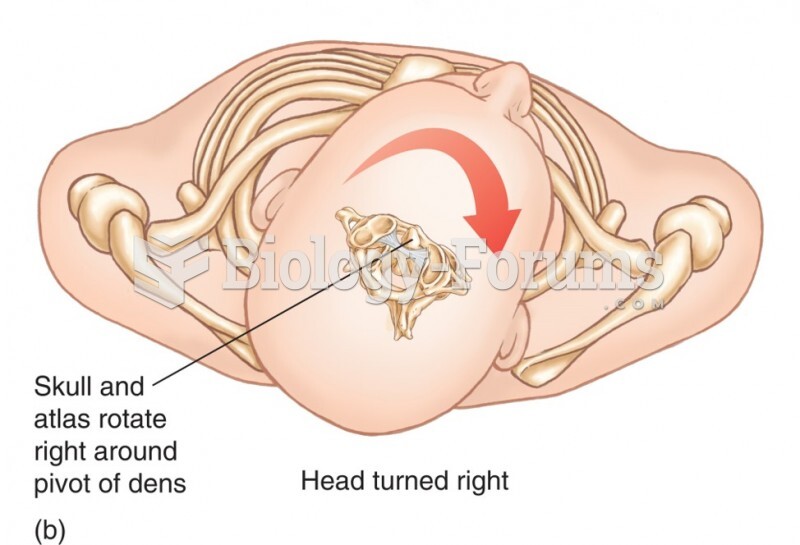 Relationship Between the Atlas and the Axis. The Dens of the Axis Provides a Pivotal Point Around Wh
|
|
|
Acceptable ranges of respiratory rate
Graph of cos(x)
graph
Finding the graph of a Parabola using certain values
Relationship Between the Atlas and the Axis. The Dens of the Axis Provides a Pivotal Point Around Wh
For a complete list of videos, visit our video library